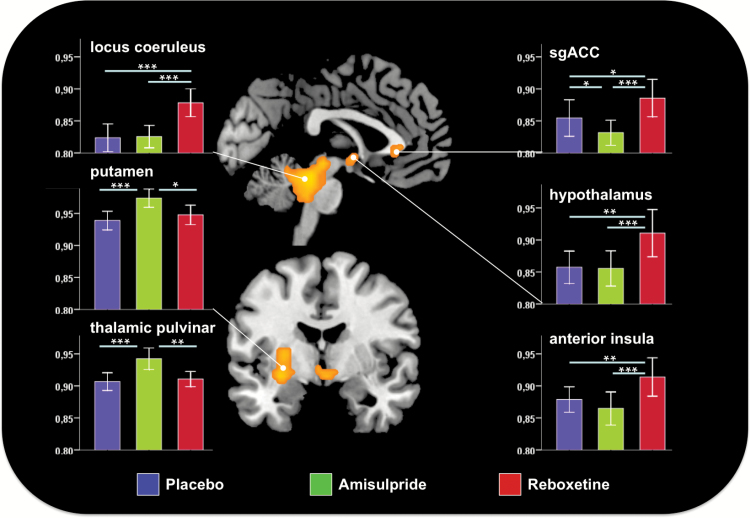
Figure 3.
Main effect of drug on the frequency amplitude of low frequency fluctuations (fALFF). Bar diagrams (+/- standard error of the mean) depict mean fALFF under placebo (blue), amisulpride (green), and reboxetine (red). Stars indicate significant changes as revealed by post hoc t-tests (*p < 0.05, **p < 0.01, ***p < 0.001).

