Figure 1.
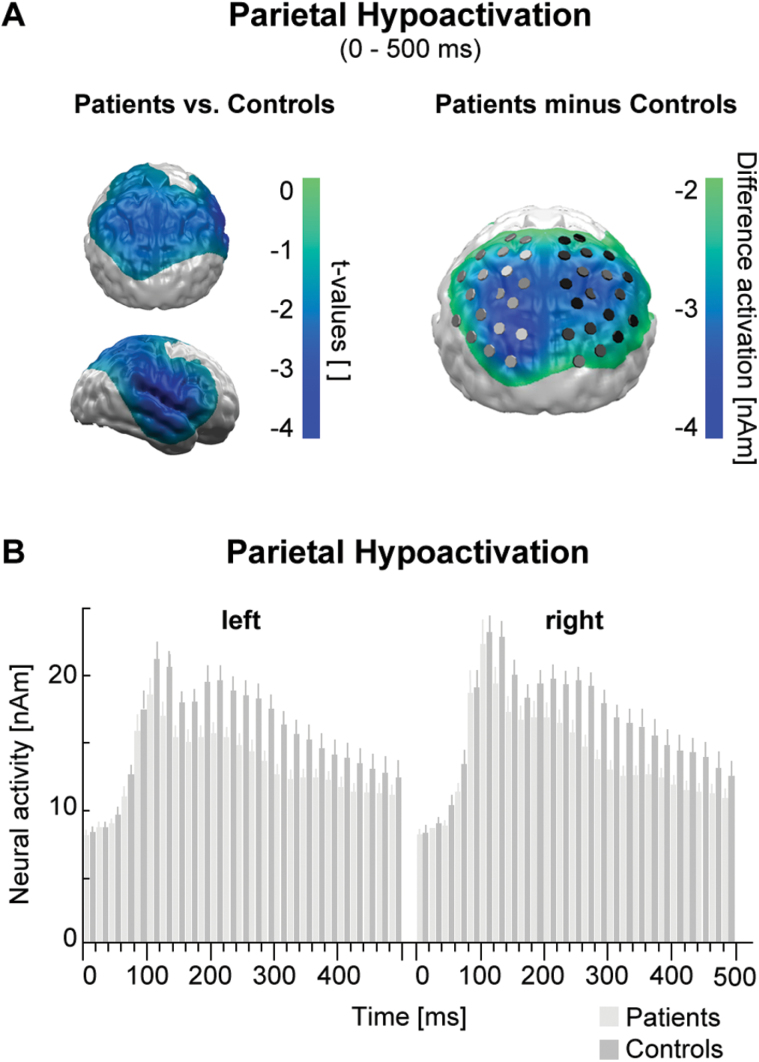
(A) Left: topography of t-tests comparing overall picture category independent activity of patients and controls. Areas with significant sustained (0–500ms) hypoactivations in the patient group are color coded (masked at random permutation cluster level p < 0.05). Right: topography of overall difference activations between patients and controls. Markers indicate inverse test sources at right and left parietal regions of interest.
(B) Time course of left and right parietal neural activation for patients and controls. A first significant hypoactivation appeared between 50 and 70ms and was sustained after 120ms.

