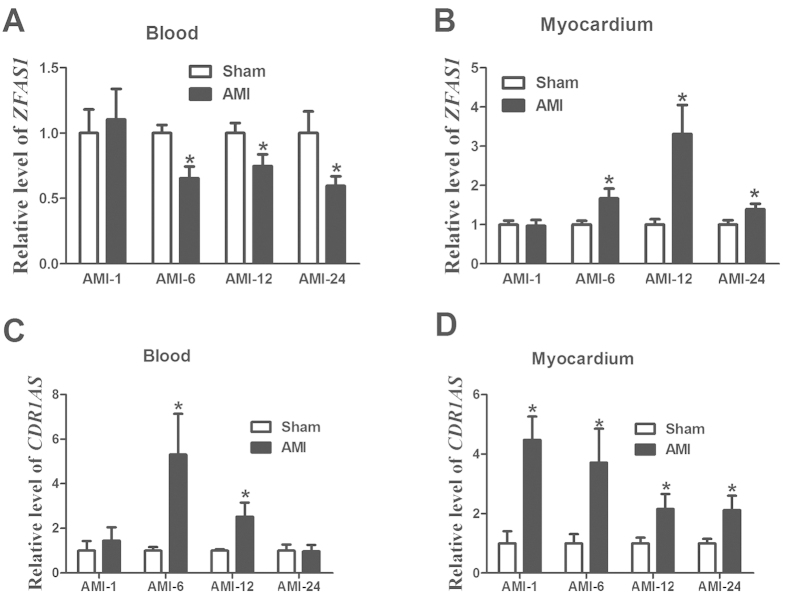
Figure 3.
Changes of circulating (A,C) and myocardium (B,D) ZFAS1 and CDR1AS levels in a mouse model of AMI at different time point (1 h, 6 h,12 h, and 24 h), determined by real-time RT-PCR methods. The number of blood samples ranged from 6 to 16 for different groups. AMI represent acute myocardial infarction with LAD. Data were present as means ± SEM.

