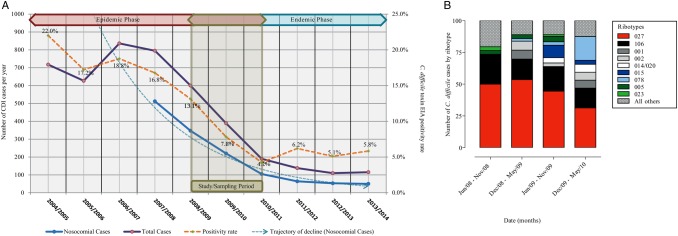
Figure 1.
Trends of Clostridium difficile incidence in the Royal Liverpool and Broadgreen University Hospitals National Health Service Trust complex. A, Incidences of C. difficile cases during the period from 2004 to 2013. Sampling period was between July 2008 and May 2010. The right y-axis is absolute number of C. difficile infection (CDI) cases and the left y-axis is percentage of positive C. difficile toxin enzyme immunoassays (EIAs). Different CDI cases are shown in straight blue (nosocomial) and straight purple (total) lines. Trajectory of decline in nosocomial cases is shown by blue broken line. Percentage of positive C. difficile toxin EIA is shown by gold broken line. B, Percentage of CDI cases based on most frequent C. difficile polymerase chain reaction ribotypes is shown by red (027/ST1), black (106), dark gray (001), gray (002), white (014/020), dark blue (015), sky blue (078), dark green (005), light green (023), and black dotted (other ribotypes) boxes during sampling period.

