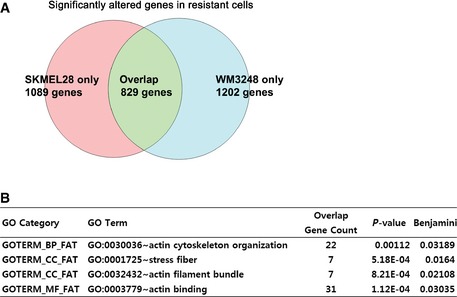
Figure EV1. Comparison of expression profiles between PLX4032‐resistant and parental cells reveals significant alterations of multiple genes encoding actin cytoskeleton regulators.

- Venn diagram showing the number of significantly altered genes in a microarray analysis comparing parental and resistant cells of SKMEL28 and WM3248.
- A list showing significantly enriched gene ontology terms (Benjamini–Hochberg FDR < 0.05) related to the actin cytoskeleton on functional annotation charts which analyze 829 significantly altered genes.
