
Figure EV3. Validation of the specificity of YAP/TAZ knockdown, and comparison of YAP/TAZ knockdown sensitivity between parental and resistant melanoma cells.
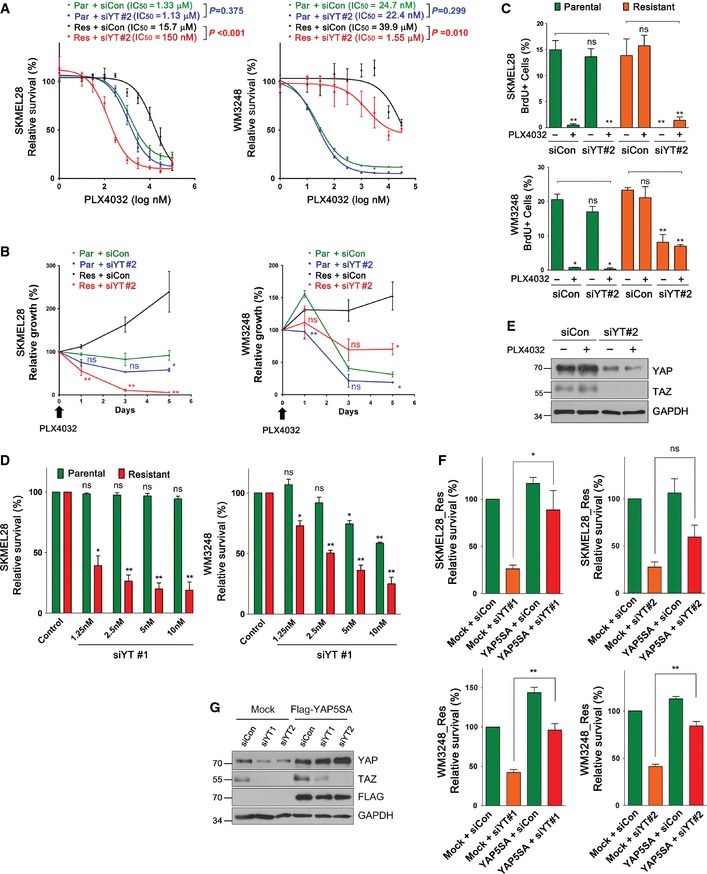
- PLX4032 dose–response curves of parental and resistant cells after YAP/TAZ knockdown. Cells were transfected with either control or YAP/TAZ siRNA set 2 (siYT#2) for 72 h, and then treated with PLX4032 at the indicated concentrations for additional 72 h. Relative cell viability, compared to DMSO control, was measured by CCK8 assay. Sigmoidal dose–response curves were fitted to data, and significance of the difference in IC 50 values was determined by extra sum‐of‐squares F test.
- Time‐course analyses of cell viability after YAP/TAZ knockdown. Cells were transfected with the indicated siRNAs for 48 h, and then treated with PLX4032 (2 μM) for the indicated times. Relative cell viability, compared to initial cell viability, was measured by CCK8 assay. Significance of the difference between control and YAP/TAZ depletion for parental or resistant cells were determined by t‐test.
- Quantification of BrdU assay of SKMEL28 and WM3248 cells transfected with either control siRNA or siYT#2. Cells were treated as in Fig 4C.
- Cell viability analyses of SKMEL28 and WM3248 cells transfected with variable doses of YAP/TAZ siRNAs and control siRNA. Cells were transfected with siRNAs for 144 h and cell viability, compared with that of control siRNA‐transfected cells, was measured by CCK8 assay.
- Immunoblotting for the indicated proteins 48 h after transfection of siRNAs followed by 24‐h PLX4032 or DMSO treatment.
- Cell viability analyses of resistant SKMEL28 and WM3248 cells transfected with siRNAs and siRNA‐resistant flag‐YAP‐5SA retrovirus. Cells were transfected with retrovirus for 24 h, and then transfected with the indicated siRNAs (forward transfection) for 72 h (SKMEL28) or 144 h (WM3248). Relative cell viability, compared with that of mock and control siRNA‐transfected cells, was measured by CCK8 assay.
- Immunoblotting of the indicated proteins in transfected HEK293T. HEK293T cells were transfected with siRNA‐resistant Flag‐YAP5SA retrovirus for 24 h, and then transfected with the indicated siRNAs for 72 h (reverse transfection).
Data information: All data are mean and SEM (three biologic replicates). In all graphs except (A), P‐values were determined by t‐test (*P < 0.05 and **P < 0.01). Source data are available online for this figure.