
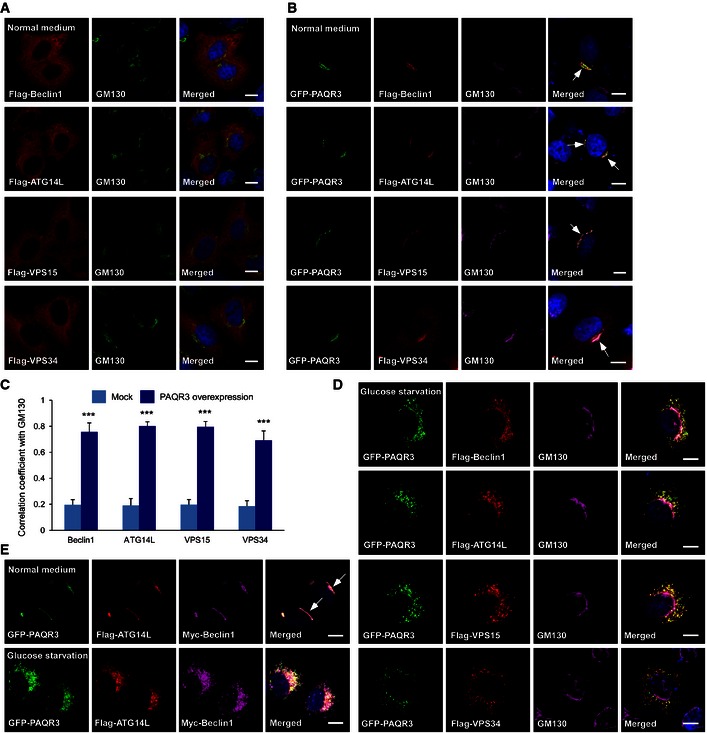
Figure EV2. ATG14L‐linked VPS34 complex coexists with PAQR3 in the Golgi apparatus.
-
A, BHeLa cells were transfected with the plasmids as indicated, followed by immunofluorescence staining with the indicated antibodies. The arrow indicates co‐localization of PAQR3 with the indicated proteins at the Golgi apparatus. Scale bar: 10 μm.
-
CCo‐localization coefficient between the indicated proteins and GM130 in the presence or absence of PAQR3 overexpression. At least fifty cells were quantified from each independent experiment, which was repeated for three times with similar results. Values are presented as mean ± SD, ***P < 0.001.
-
DHeLa cells were transfected with the plasmids as indicated. After glucose starvation for 4 h, the cells were fixed and used in immunofluorescence staining and confocal analysis. Scale bar: 10 μm.
-
EHeLa cells were co‐transfected with GFP‐fused PAQR3, Flag‐tagged ATG14L, and Myc‐tagged Beclin1 simultaneously. At 24 h after transfection, the cells were fixed for immunofluorescence staining before or after glucose starvation as indicated. The arrow indicates apparent co‐localization of ATG14L and Beclin1 with PAQR3. Scale bar: 10 μm.