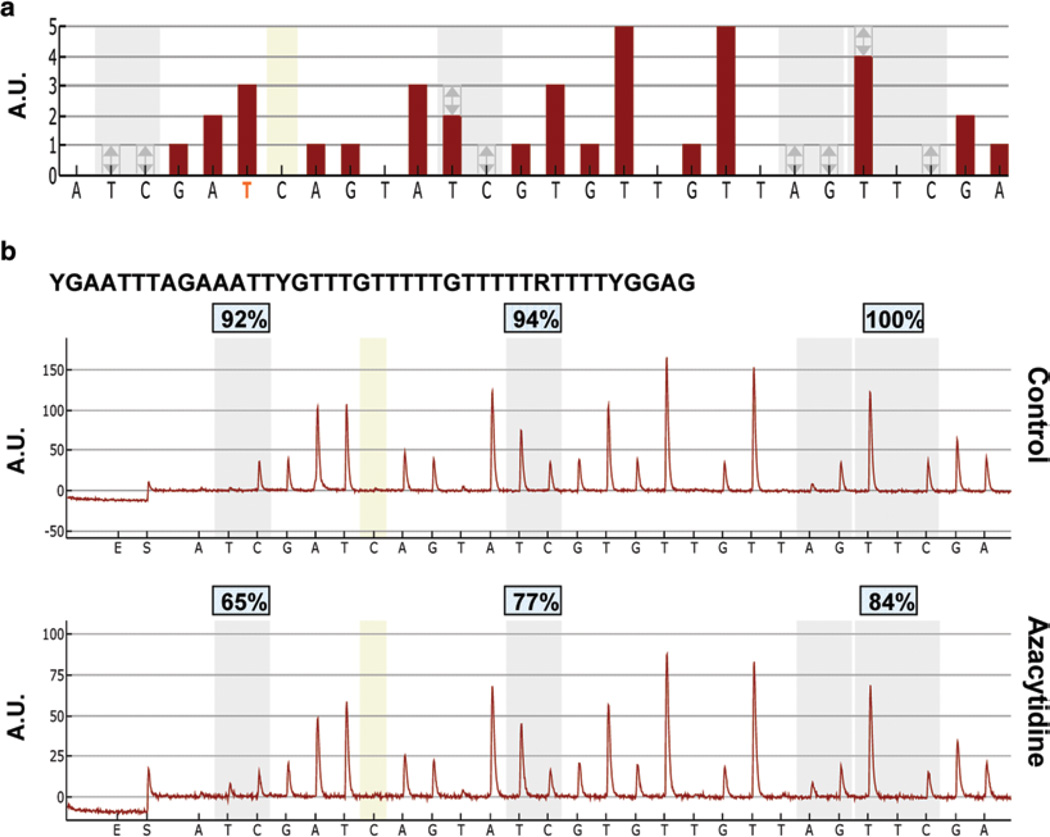
Fig. 5.
Representative pyrograms showing hypomethylation of the B1 element following 5-azacytidine treatment. (a) Theoretical pyrogram generated by analytical software based on the input sequence to analyze for B1 element pyrosequencing primer 2 (see table). (b) Pyrograms of DNA isolated from T cells cultured in the absence (control) or presence of cytosine analog 5-azacytidine, a known hypomethylating agent. The B1 “sequence to analyze 2” is shown bolded. Grey shaded areas indicate CpG sites, tan shaded bars indicate bisulfite control dispensations. Percent methylation is indicated above each CpG site

