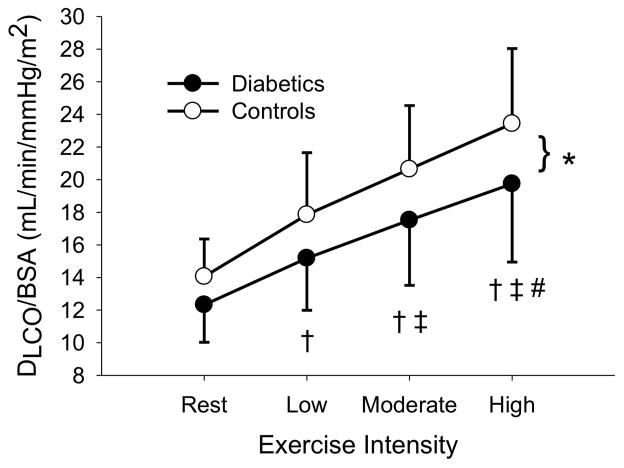
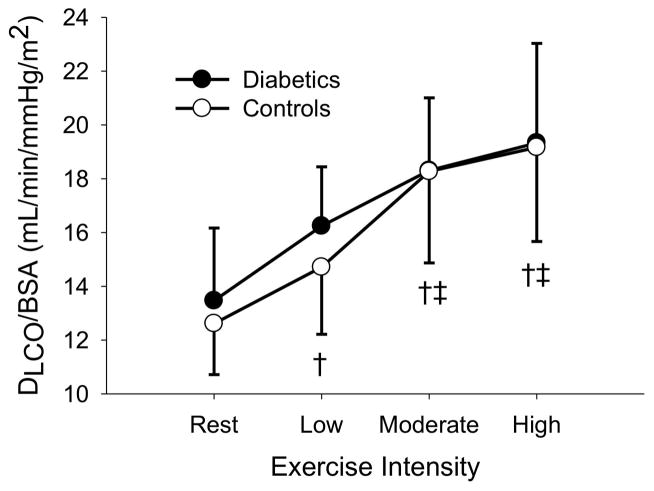
Figure 1.
Figure 1A: DLCO/BSA at rest, low, moderate, and high exercise intensities for the long duration diabetics and their matched controls. * (p < 0.05) signifies a difference between diabetics and controls. † (p < 0.05) different from rest. ‡ (p < 0.05) different from low intensity exercise # (p < 0.05) different from moderate intensity exercise.
Figure 1B: DLCO/BSA at rest, low, moderate, and high exercise intensities for the short duration diabetics and their matched controls. † (p < 0.05) different from rest. ‡ (p < 0.05) different from low intensity exercise.


