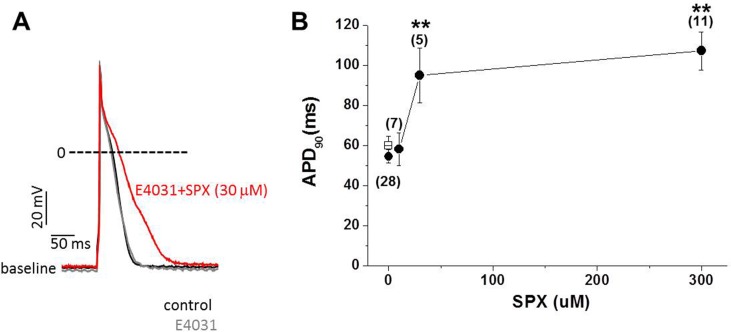
Fig 1. The effect of SPX on APs recorded in the presence of E4031.
Action potentials were recorded by pacing myocytes at 2 Hz. In the presence of 10 μM E4031, SPX (10–300 μM) was applied. Data were obtained at 37°C by using the perforated patch technique. A, Examples of action potentials recorded before (gray) and after (red) SPX exposure at a concentration of 30 μM. The control action potential (black) before E-4031 treatment was also overlaid for comparison. B, APD90 was plotted as a function of SPX concentration. Asterisks indicate statistical significance (paired t-test; *P < 0.05, **P < 0.01). Error bars indicate standard error. The numbers in parentheses indicate the number of cells tested.

