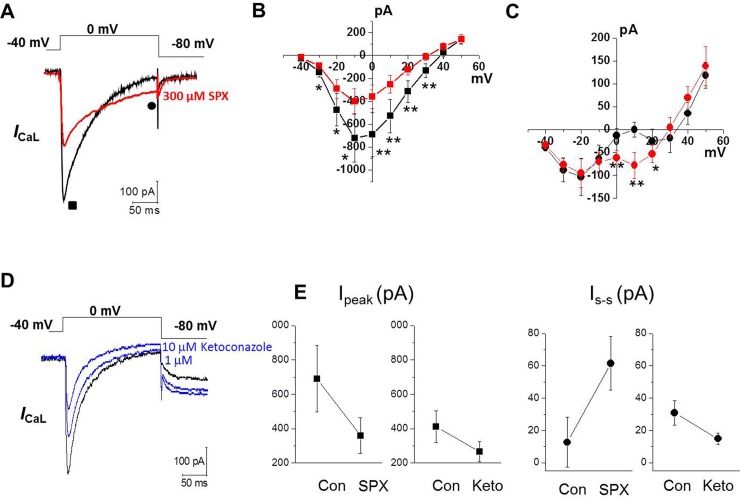
Fig 2. Effect of SPX on ICaL.
A, Representative traces of ICaL during a 200-ms voltage-clamp pulse from −40 to 0 mV before (black) and after (red) exposure to 300 μM SPX. B–C, current–voltage (I-V) relationships of Ipeak (■, B) and Iend of pulse (●, C) under control conditions (black) and after application of 300 μM SPX (red) (n = 10). D, Representative traces of ICaL to 1 μM and 10 μM of ketoconazole (blue) (n = 4). E, The comparison of Ipeak (■, left) and Is-s (●, right) from ICaL before and after 300 μM SPX (n = 10) or 10 μM ketoconazole (n = 4). *P < 0.05 **P < 0.01.

