
Figure 2. Mitochondrial‐permeable iron chelator is protective against oxidative stress in vitro .
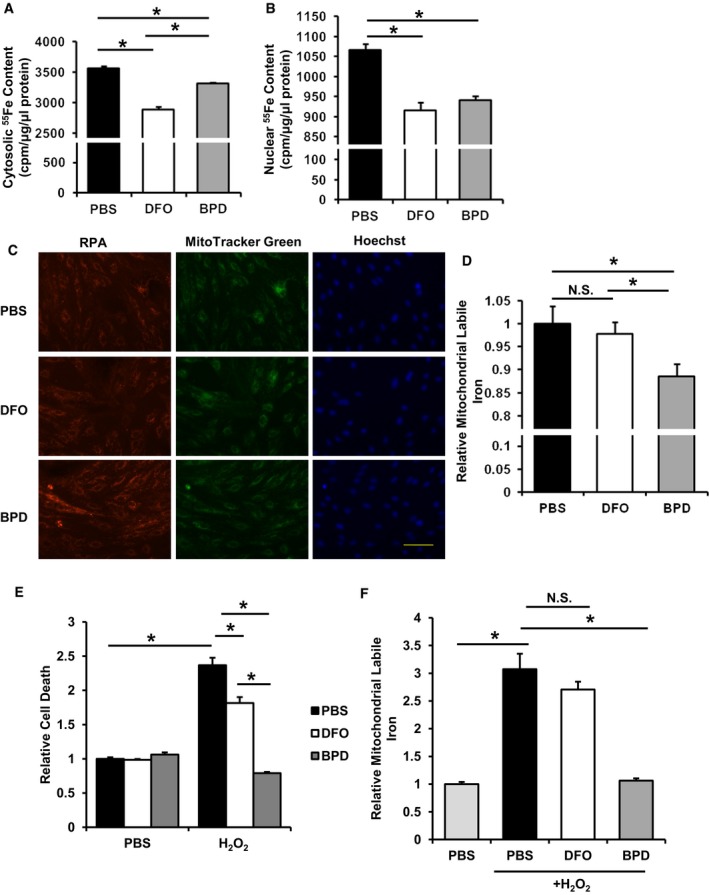
- Cytosolic iron in H9c2 cells preloaded with radioactive 55Fe and treated with the indicated iron chelators. ANOVA followed by post hoc Tukey's test was performed. *P = 7.9E‐8 PBS vs. DFO. *P = 9.4E‐6 BPD vs. DFO. *P = 0.003 PBS vs. BPD. N = 4 independent samples for PBS group and N = 6 independent samples for other groups.
- Nuclear iron in H9c2 cells preloaded with radioactive 55Fe and treated with the indicated iron chelators. ANOVA followed by post hoc Tukey's test was performed. *P = 0.0003 PBS vs. BPD. *P = 5.58E‐5 PBS vs. DFO. N = 4 independent samples for PBS group and N = 6 independent samples for other groups.
- Representative RPA fluorescence staining for labile mitochondrial iron in H9c2 cells with the indicated iron chelator treatment. Scale bar, 100 μm.
- Labile mitochondrial iron measured by RPA fluorescence in H9c2 cells with the indicated iron chelator treatment. ANOVA followed by post hoc Tukey's test was performed.*P = 0.016 PBS vs. BPD. *P = 0.04 DFO vs. BPD. N = 8 independent samples for each group.
- H2O2‐induced cell death in H9c2 cells with the indicated treatments. ANOVA followed by post hoc Tukey's test was performed. *P = 5E‐8 PBS‐PBS vs. PBS‐H2O2. *P = 4E‐6 PBS‐H2O2 vs. DFO‐H2O2. *P = 5E‐8 PBS‐H2O2 vs. BPD‐H2O2. *P = 1E‐7 BPD‐H2O2 vs. DFO‐H2O2. N = 6 independent samples for each group.
- Labile mitochondrial iron in H9c2 cells with the indicated treatment. PBS with and without H2O2 data was copied from Fig 1C. ANOVA followed by post hoc Tukey's test was performed. *P = 1E‐8 PBS‐PBS vs. PBS‐H2O2. *P = 3E‐9 PBS‐H2O2 vs. BPD‐H2O2. N = 8 independent samples for PBS‐PBS and N = 12 for the other groups.