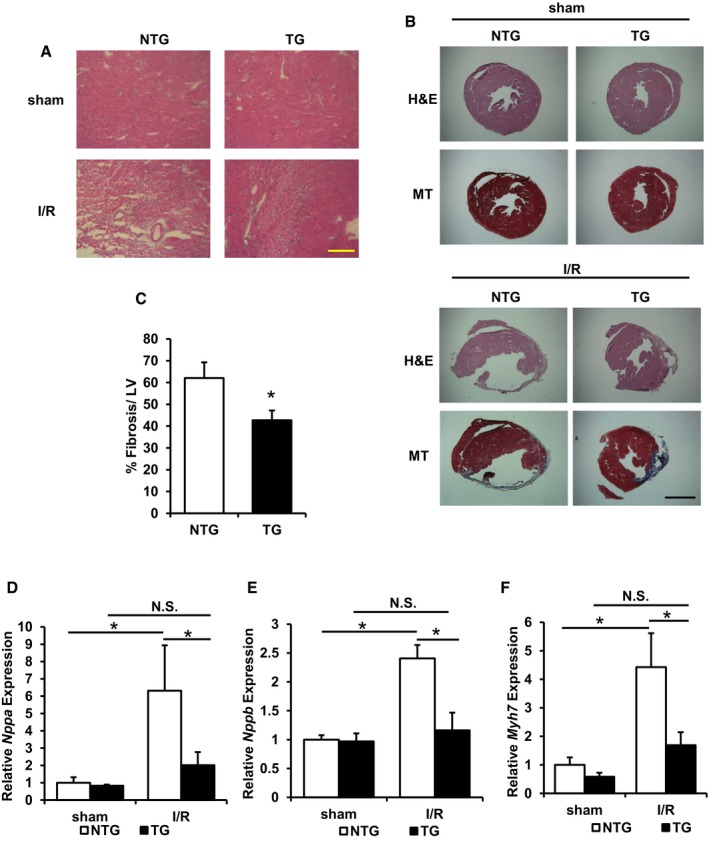
Representative H&E staining of peri‐infarct area demonstrated reduced cellular injury in ABCB8 TG mice after I/R. Scale bar, 115 μm.
Representative H&E and Masson's trichrome (MT) staining in mouse heart 28 days after the indicated procedure. Scale bar, 1,100 μm.
Quantification of tissue fibrosis in ABCB8 NTG and TG mice subjected to I/R. *P = 0.047 with two‐tailed unpaired t‐test. Two to three sections from each mice were quantified; N = 4 mice for NTG and N = 6 mice for TG.
Nppa expression in mice subjected to sham or I/R procedure. ANOVA followed by post hoc Tukey's test was performed. *P = 0.006 NTG‐sham vs. NTG‐I/R. *P = 0.015 NTG‐I/R vs. TG‐I/R. N = 5 mice for NTG‐sham and TG‐I/R, N = 6 mice for TG‐sham, and N = 4 mice for NTG‐I/R.
Nppb expression in mice subjected to sham or I/R procedure. ANOVA followed by post hoc Tukey's test was performed. *P = 0.001 NTG‐sham vs. NTG‐I/R. *P = 0.004 NTG‐I/R vs. TG‐I/R. N = 5 mice for NTG‐sham and TG‐I/R, N = 6 mice for TG‐sham, and N = 4 mice for NTG‐I/R.
Myh7 expression in mice subjected to sham or I/R procedure. ANOVA followed by post hoc Tukey's test was performed. *P = 0.002 NTG‐sham vs. NTG‐I/R. *P = 0.011 NTG‐I/R vs. TG‐I/R. N = 5 mice for NTG‐sham and TG‐I/R, N = 6 mice for TG‐sham, and N = 4 mice for NTG‐I/R.
Data information: All data are expressed as mean ± SEM. N.S., not significant.