
Figure 6. Pharmacological modulation of mitochondrial iron protects against cellular damage after I/R.
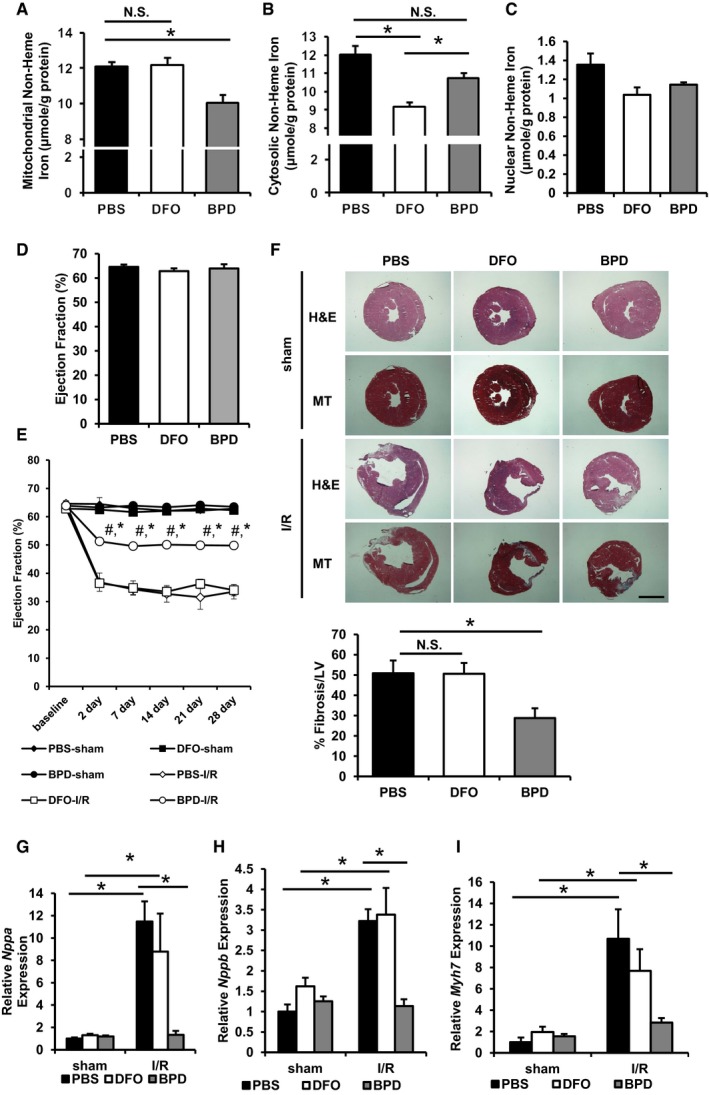
- Mitochondrial non‐heme iron in wild‐type mice treated with vehicle control or the indicated iron chelator for 7 days. ANOVA followed by post hoc Tukey's test was performed. *P = 0.03. N = 4 mice for PBS and DFO, and N = 5 mice for BPD.
- Cytosolic non‐heme iron in wild‐type mice treated with vehicle control or the indicated iron chelator for 7 days. ANOVA followed by post hoc Tukey's test was performed. *P = 5E‐4 PBS vs. DFO. *P = 0.01 DFO vs. BPD. P = 0.06 PBS vs. DFO. N = 4 mice for PBS and DFO, and N = 5 mice for BPD.
- Nuclear non‐heme iron in wild‐type mice treated with vehicle control or the indicated iron chelator for 7 days. N = 4 mice for PBS and DFO and N = 5 mice for BPD.
- Cardiac function in wild‐type mice treated with vehicle control or the indicated iron chelator for 7 days. N = 5 mice for each group.
- Cardiac function of chelator‐treated mice after I/R. ANOVA followed by post hoc Tukey's test was performed for each time point. *P < 0.0001 compared to PBS‐I/R group at the same time point. # P < 0.0001 compared to PBS‐sham group at the same time point. Exact P‐values are included in Appendix Table S3. N = 5 mice PBS‐sham and BPD‐I/R and N = 6 mice for all other groups.
- Representative hematoxylin and eosin (H&E) and Masson's trichrome (MT) staining of heart sections in mice with the indicated chelator treatment undergone sham or I/R. Scale bar, 1,100 μm. Bar graph represents the quantification of tissue fibrosis. ANOVA followed by post hoc Tukey's test was performed. *P = 0.048. Two to three sections from each mice were quantified, N = 4 mice for PBS, N = 5 mice for DFO, and N = 6 mice for BPD.
- Nppa expression in mice subjected to sham or I/R procedure. ANOVA followed by post hoc Tukey's test was performed. *P = 0.002 PBS‐sham vs. PBS‐I/R. *P = 0.02 DFO‐sham vs. DFO‐I/R. *P = 0.007 PBS‐I/R vs. BPD‐I/R. N = 6 mice for PBS‐sham and DFO‐sham and N = 4 mice for all other groups.
- Nppb expression in mice subjected to sham or I/R procedure. ANOVA followed by post hoc Tukey's test was performed. *P = 0.0007 PBS‐sham vs. PBS‐I/R. *P = 0.014 DFO‐sham vs. DFO‐I/R. *P = 0.003 PBS‐I/R vs. BPD‐I/R. N = 6 mice for PBS‐sham and DFO‐sham, N = 4 mice for all other groups.
- Myh7 expression in mice subjected to sham or I/R procedure. ANOVA followed by post hoc Tukey's test was performed. *P = 0.0001 PBS‐sham vs. PBS‐I/R. *P = 0.038 DFO‐sham vs. DFO‐I/R. *P = 0.006 PBS‐I/R vs. BPD‐I/R. N = 6 mice for PBS‐sham and DFO‐sham and N = 4 mice for all other groups.