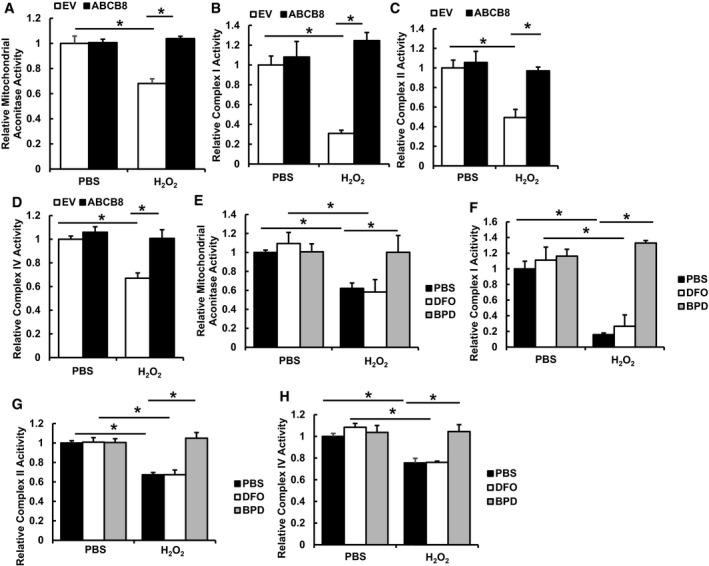
Mitochondrial aconitase activity in H9c2 cells with or without ABCB8 overexpression and treated with or without H2O2. N = 4 independent samples for each group. ANOVA followed by post hoc Tukey's test was performed. *P = 0.0004 EV‐PBS vs. EV‐H2O2. *P = 0.0001 EV‐H2O2 vs. ABCB8‐H2O2.
Complex I activity in H9c2 cells with or without ABCB8 overexpression and treated with or without H2O2. N = 6 independent samples for each group. ANOVA followed by post hoc Tukey's test was performed. *P = 0.0005 EV‐PBS vs. EV‐H2O2. *P = 0.00001 EV‐H2O2 vs. ABCB8‐H2O2.
Complex II activity in H9c2 cells with or without ABCB8 overexpression and treated with or without H2O2. N = 6 independent samples for each group. ANOVA followed by post hoc Tukey's test was performed. *P = 0.001 EV‐PBS vs. EV‐H2O2. *P = 0.001 EV‐H2O2 vs. ABCB8‐H2O2.
Complex IV activity in H9c2 cells with or without ABCB8 overexpression and treated with or without H2O2. N = 6 independent samples for each group. ANOVA followed by post hoc Tukey's test was performed. *P = 0.0008 EV‐PBS vs. EV‐H2O2. *P = 0.0006 EV‐H2O2 vs. ABCB8‐H2O2.
Mitochondrial aconitase activity in H9c2 cells treated with the indicated iron chelators with or without H2O2. N = 4 independent samples in each group. ANOVA followed by post hoc Tukey's test was performed. *P = 0.036 PBS‐PBS vs. PBS‐H2O2. *P = 0.0047 DFO‐PBS vs. DFO‐H2O2. *P = 0.035 PBS‐ H2O2 vs. BPD‐H2O2.
Complex I activity in H9c2 cells treated with the indicated iron chelators with or without H2O2. N = 6 independent samples for each group. ANOVA followed by post hoc Tukey's test was performed. *P = 0.0004 PBS‐PBS vs. PBS‐H2O2. *P = 0.0003 DFO‐PBS vs. DFO‐H2O2. *P < 0.0001 PBS‐ H2O2 vs. BPD‐H2O2.
Complex II activity in H9c2 cells treated with the indicated iron chelators with or without H2O2. N = 6 independent samples for each group. ANOVA followed by post hoc Tukey's test was performed. *P = 0.0001 PBS‐PBS vs. PBS‐H2O2. *P < 0.0001 DFO‐PBS vs. DFO‐H2O2. *P < 0.0001 PBS‐ H2O2 vs. BPD‐H2O2.
Complex IV activity in H9c2 cells treated with the indicated iron chelators with or without H2O2. N = 6 independent samples for each group. ANOVA followed by post hoc Tukey's test was performed. *P = 0.02 PBS‐PBS vs. PBS‐H2O2. *P = 0.0009 DFO‐PBS vs. DFO‐H2O2. *P = 0.006 PBS‐ H2O2 vs. BPD‐H2O2.
Data information: All data are expressed as mean ± SEM.

