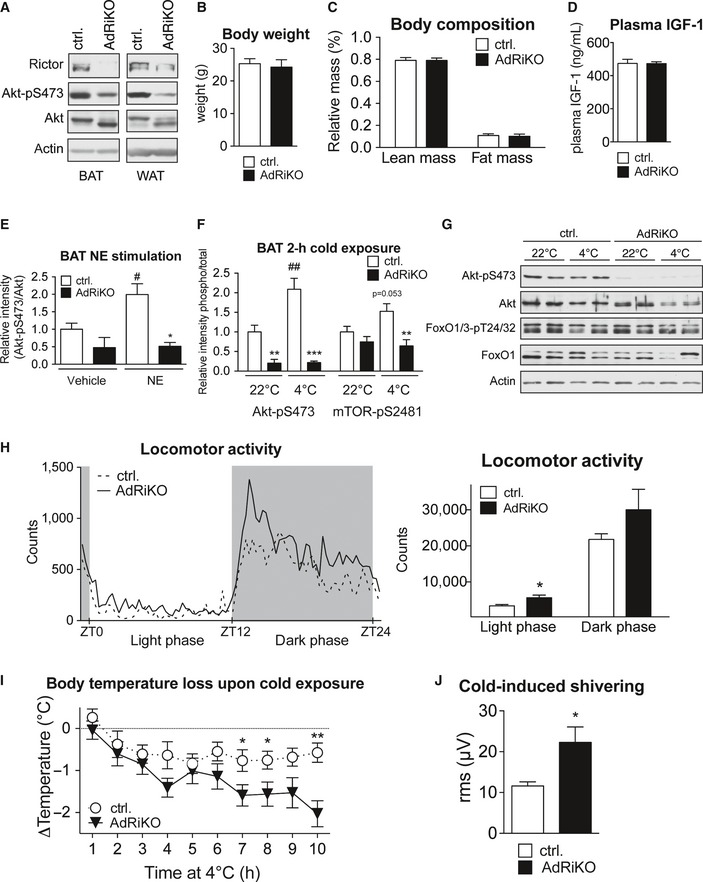
Immunoblot analysis of BAT and sWAT of AdRiKO and control mice housed at 22°C for the indicated proteins.
Body weight of AdRiKO and control mice housed at 22°C [n = 14 (control), n = 12 (AdRiKO)].
Body composition of AdRiKO and control mice housed at 22°C (n = 18/group).
Plasma IGF‐1 levels in AdRiKO and control mice housed at 22°C [n = 11 (control), n = 9 (AdRiKO)].
Quantification of Akt‐pS473 band intensity relative to total Akt band intensity shown in Fig
2B (
n = 3/group).
Quantification of Akt‐pS473 and mTOR‐pS2481 band intensity relative to total Akt or total mTOR band intensity shown in Fig
2C (
n = 6/group).
Immunoblot analysis of sWAT of AdRiKO and control mice housed at 22 or 4°C for 2 h for the indicated proteins (n = 6/group, each lane represents a mix of 3 mice).
Locomotor activity of AdRiKO and control mice housed at 22°C (n = 13/group).
Body temperature loss of AdRiKO and control mice upon cold exposure with ad libitum access to food [n = 11 (control), n = 10 (AdRiKO)].
Cold‐induced shivering of AdRiKO and control mice housed at 4°C for 4 h (n = 6/group).
Data information: Data represent mean ± SEM. Statistically significant differences between AdRiKO and control mice were determined with unpaired Student's
t‐test and indicated with asterisks (*
P < 0.05; **
P < 0.01; ***
P < 0.001). Statistically significant differences between temperatures or treatments were determined with unpaired Student's
t‐test and are indicated with a number sign (
#
P < 0.05;
##
P < 0.01). The exact
P‐value for each significant difference can be found in
Appendix Table S2.