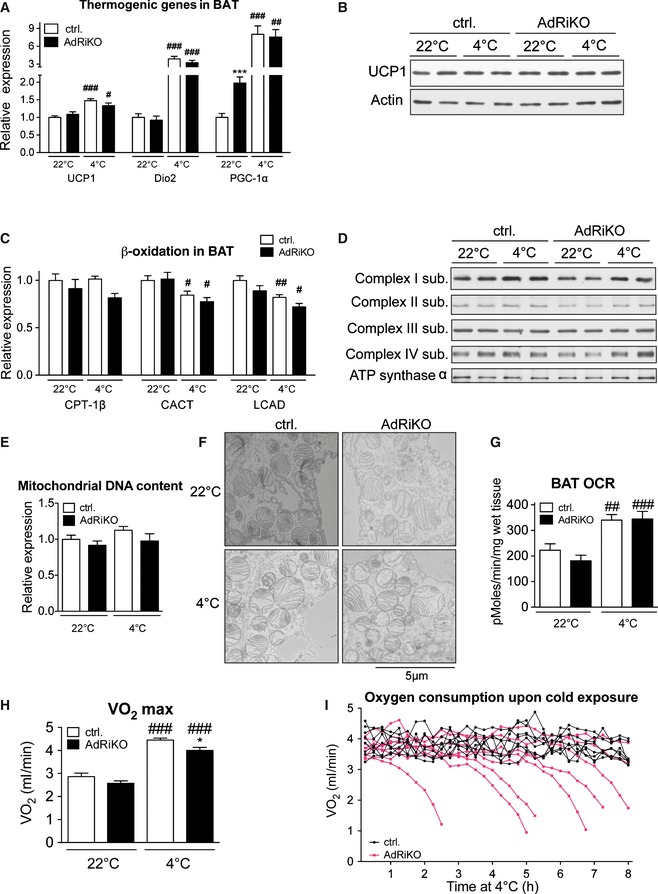
mRNA levels of the indicated genes in BAT of AdRiKO and control mice housed at 22 or at 4°C for 8 h (n = 6/group).
Immunoblot analysis of BAT from AdRiKO and control mice housed at 22 or at 4°C for 8 h for the indicated proteins (n = 6/group, each lane represents a mix of 3 mice).
mRNA levels of the indicated genes in BAT of AdRiKO and control mice housed at 22 or at 4°C for 8 h (n = 6).
Immunoblot analysis of BAT from AdRiKO and control mice housed at 22 or at 4°C for 8 h for the indicated proteins (n = 6/group, each lane represents a mix of 3 mice).
Mitochondrial DNA content of BAT from AdRiKO and control mice housed at 22 or at 4°C for 8 h (n = 6/group).
Representative electron micrographs of BAT from AdRiKO and control mice housed at 22 or at 4°C for 4 h (n = 3/group).
Oxygen consumption rate (OCR) of BAT explants from AdRiKO and control mice housed at 22 or at 4°C for 4 h (n = 7/group).
Maximal respiration (VO
2 max) of AdRiKO and control mice housed at 22 or at 4°C for 8 h [n = 9 (control 22°C), n = 7 (AdRiKO 22°C), n = 8 (control 4°C), n = 8 (AdRiKO 4°C)].
Respiration (VO
2) of AdRiKO and control mice upon cold exposure (n = 8/group).
Data information: Data represent mean ± SEM. Statistically significant differences between AdRiKO and control mice were determined with unpaired Student's
t‐test and are indicated with asterisks (*
P < 0.05; ***
P < 0.001). Statistically significant differences between temperatures were determined with unpaired Student's
t‐test and are indicated with a number sign (
#
P < 0.05;
##
P < 0.01;
###
P < 0.001). The exact
P‐value for each significant difference can be found in
Appendix Table S2.