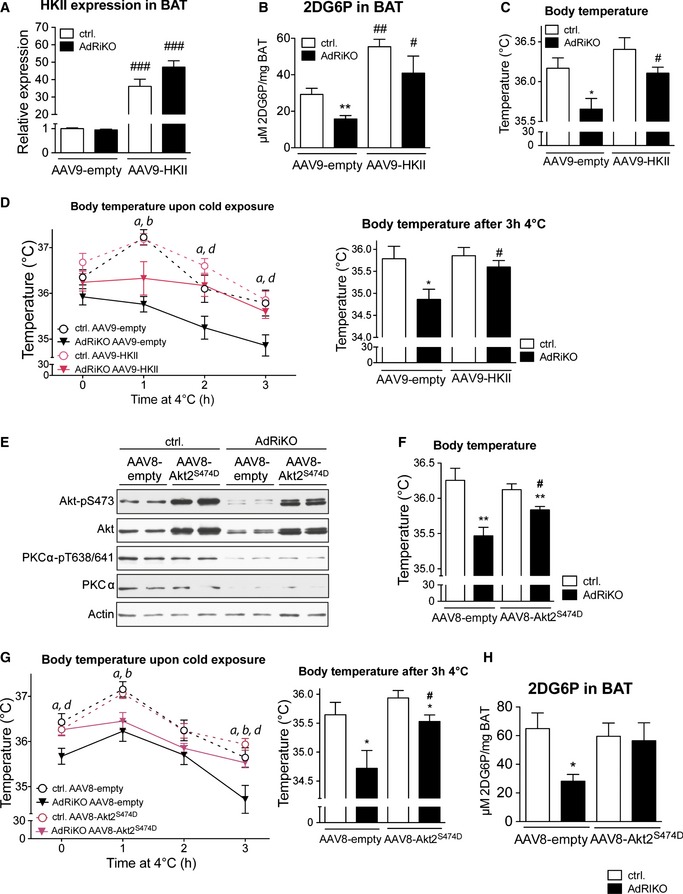
HKII mRNA expression level in BAT of AdRiKO and control mice infected with either AAV9‐HKII or AAV9‐empty (n = 8/group).
Cold‐induced 2‐deoxyglucose‐6‐phosphate (2DG6P) accumulation in BAT of AdRiKO and control mice infected with either AAV9‐HKII or AAV9‐empty housed at 4°C for 4 h (n = 8/group).
Body temperature of AdRiKO and control mice infected with either AAV9‐HKII or AAV9‐empty housed at 22°C (n = 8/group).
Body temperature upon cold exposure of AdRiKO and control mice infected with either AAV9‐HKII or AAV9‐empty. The left panel represents body temperature after each hour of cold exposure, while the right panel represents body temperature as a bar graph for the 3‐h cold exposure time point (n = 8/group). a: significant difference between AdRiKO and control mice infected with AAV9‐empty; b: significant difference between AdRiKO and control mice infected with AAV9‐HKII; d: significant difference between AdRiKO mice infected with AAV9‐empty and AAV9‐HKII.
Immunoblot analysis of BAT from AdRiKO and control mice infected with either AAV8‐Akt2S474D or AAV8‐empty (n = 6/group, each lane represents a mix of 3 mice).
Body temperature of AdRiKO and control mice infected with either AAV8‐Akt2S474D or AAV8‐empty housed at 22°C (n = 11/group).
Body temperature upon cold exposure of AdRiKO and control mice infected with either AAV8‐Akt2S474D or AAV8‐empty. The left panel represents body temperature after each hour of cold exposure, while the right panel represents body temperature as a bar graph for the 3‐h cold exposure time point (n = 11/group). a: significant difference between AdRiKO and control mice infected with AAV8‐empty; b: significant difference between AdRiKO and control mice infected with AAV8‐Akt2S474D; d: significant difference between AdRiKO mice infected with AAV8‐empty and AAV8‐Akt2S474D.
Cold‐induced 2‐deoxyglucose‐6‐phosphate (2DG6P) accumulation in BAT of AdRiKO and control mice infected with either AAV8‐Akt2S474D or AAV8‐empty housed at 4°C for 4 h [n = 7 (control AAV8‐null), n = 6 (AdRiKO AAV8‐null), n = 6 (control AAV8‐AktS474D), n = 6 (AdRiKO AAV8‐AktS474D)].
Data information: Data represent mean ± SEM. Statistically significant differences between AdRiKO and control mice were determined with unpaired Student's
t‐test and are indicated with asterisks (*
P < 0.05; **
P < 0.01). Statistically significant differences between viruses were determined with unpaired Student's
t‐test and are indicated with a number sign (
#
P < 0.05;
##
P < 0.01;
###
P < 0.001). The exact
P‐value for each significant difference can be found in
Appendix Table S2.