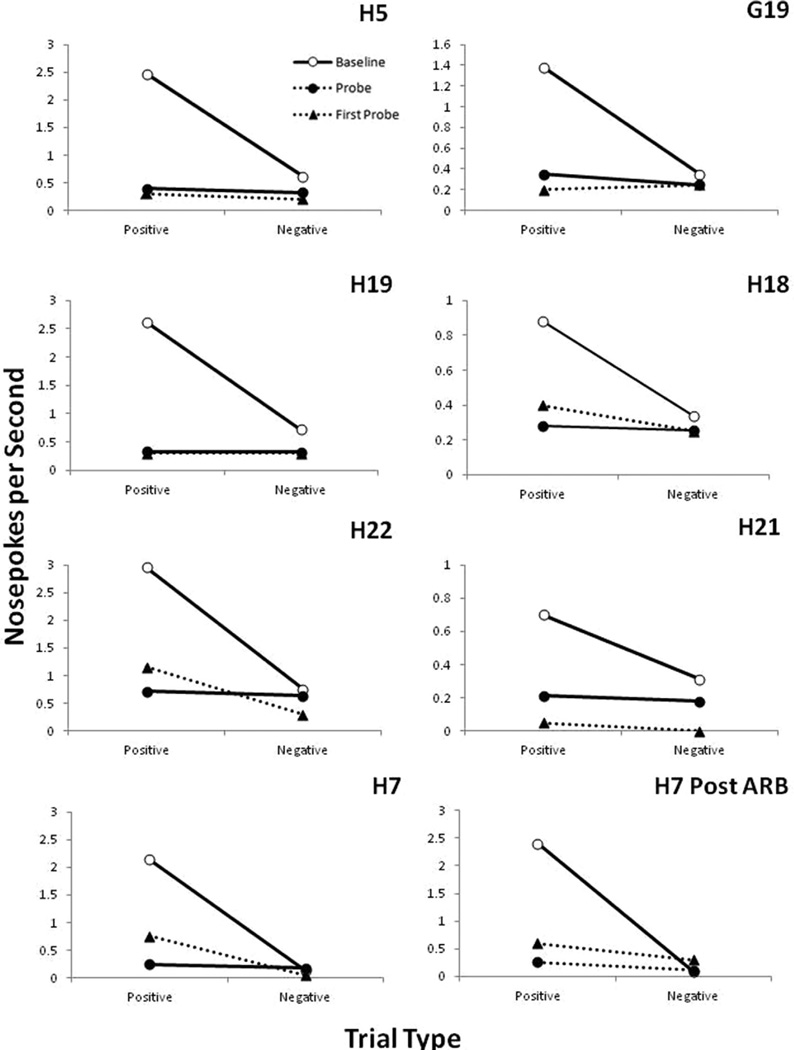
Fig. 3.
Mean response rates from the symmetry probe sessions for each rat in Experiment 1. Response rates on arbitrary baseline trials are represented by open circles. Response rates to probe trials are represented by closed circles. Response rates on the first symmetry probe session are represented by triangles. The bottom panels show the two sets of probe sessions administered to Rat H7 with the left panel showing probe sessions following mixed identity-arbitrary training and the right panel showing the first set of probe sessions obtained following training only with the arbitrary conditional discrimination.

