-
A
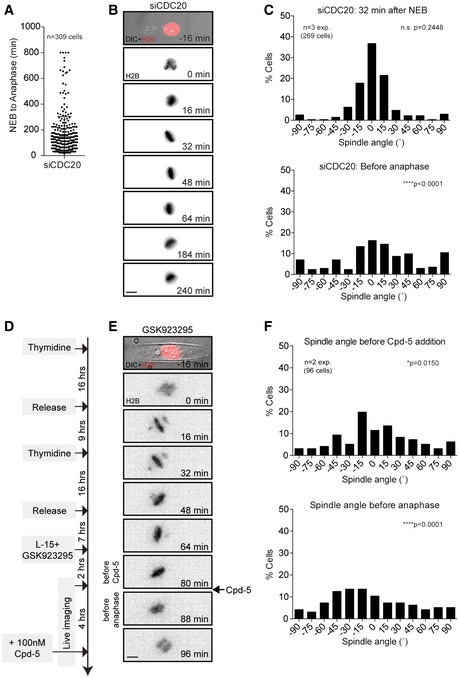
Average time in mitosis of U2OS cells transfected with CDC20 siRNA for 24 h. Error bar represents mean ± SD.
-
B, C
Live‐cell images and histograms of GFP‐H2B U2OS cells filmed on rectangular micropatterns after CDC20 depletion. The spindle angles were scored at 32 min after NEB (top) and one frame before cells eventually exit mitosis (bottom).
-
D
Schematic showing the experimental setup for the synchronization and live‐cell imaging of micropatterned U2OS cells that enter mitosis in the presence of a CENP‐E inhibitor to induce chromosome misalignments and subsequently are forced out of mitosis by the addition of the Mps1 inhibitor Cpd‐5.
-
E, F
Example cell and spindle angle histograms of cells one frame before the addition of Cpd‐5 (top) and one frame before mitotic exit (bottom).
Data information: (B, E) Scale bars represent 10 μm. Distributions in (C, F) were compared against the distributions of Fig
1B (control siGAPDH) using non‐parametric Kolmogorov‐Smirnov test. Statistical difference between the distributions is indicated by: ****
P < 0.0001 and *
P < 0.05.

