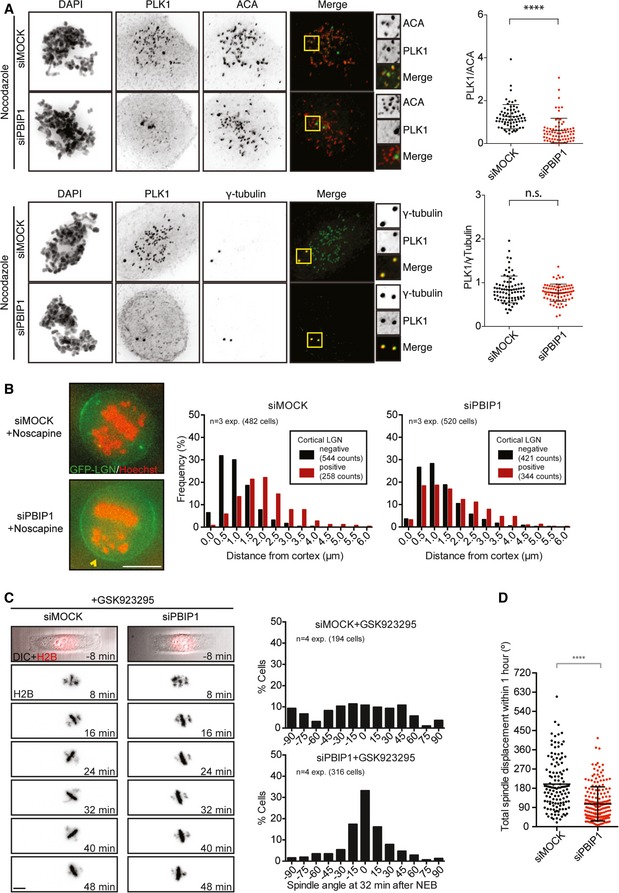
Cells were mock‐ or PBIP1‐depleted by two sequential rounds of siRNA transfection after 24 and 48 h and analyzed after 72 h.
Immunofluorescence images and quantifications of KT‐ and centrosome‐localized Plk1 in U2OS cells after PBIP1 depletion. Cells were treated with nocodazole for 30 min and fixed. Cells were stained with γ‐tubulin or the centromere marker ACA, Plk1, and DAPI. Top: siMock n = 67, siPBIP1 n = 72 and bottom: siMock n = 40, siPBIP1 n = 40 cells from three experiments. ****P < 0.0001, and Mann–Whitney test, mean ± SD.
Representative images and histograms showing the effect of chromosome position on cortical LGN enrichment after 72 h of mock and PBIP1 depletion. Bar represents 10 μm.
Live‐cell images and histograms of GFP‐H2B U2OS cells mock‐transfected or with siPBIP1 filmed on rectangular micropatterns in the presence of a CENP‐E inhibitor. The spindle angles for both conditions were scored at 32 min after NEB.
The total spindle angle displacement within the first hour of mitosis was determined by measuring the spindle angle at each time point and calculating the sum of the Δ spindle angle between each time point. Dataset from (C) and cells exiting mitosis within 1 h were excluded. siMock n = 127 and siPBIP1 n = 187 cells from four experiments. ****P < 0.0001, and Mann–Whitney test, mean ± SD.

