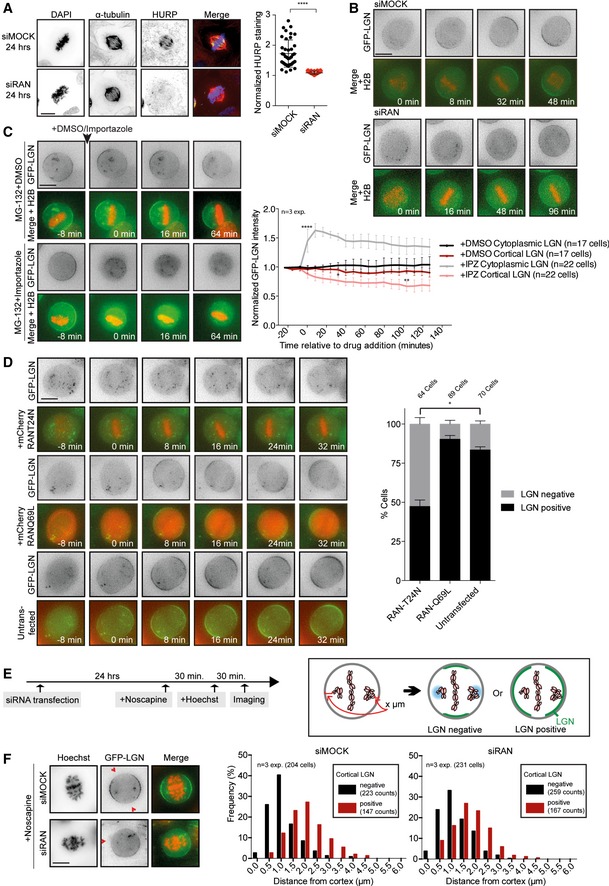
Representative immunofluorescence image of a U2OS cell after Ran depletion. Cells were either mock‐transfected or with Ran siRNA for 24 h. After fixation, the cells were stained with α‐tubulin, HURP, and DAPI. For the quantification of the HURP staining, the spindle area was sectioned into two parts, one half in the vicinity of the chromosomes and the other half in the vicinity of the spindle pole. The mean HURP signal intensity within the section of the spindle close to the chromosomes was normalized to its mean intensity in the region close to the poles. n = 40 cells per condition from two experiments. ****P < 0.0001 and unpaired t‐test. Graph shows mean ± SD.
Representative live‐time microscopy images of mitotic HeLa cells stably expressing GFP‐LGN and transiently expressing RFP‐H2B after mock and Ran depletion. Time is relative to NEB.
HeLa cells stably expressing GFP‐LGN and transiently expressing RFP‐H2B were treated for 30 min with 5 μM MG‐132. Subsequently, DMSO or 40 μM importazole was added to the medium while filming. Images were taken every 8 min. The graph on the right shows the quantification of cortical and cytoplasmic GFP‐LGN levels over time. Intensity values are normalized over the background intensities measured around the cell. ANOVA Dunnett's multiple comparisons test. Graph shows mean ± SEM. (****P < 0.0001, **P < 0.003, *P < 0.05).
HeLa cells stably expressing GFP‐LGN were transfected for 48 h with mCherry‐RanT24N or mCherry‐RanQ69L constructs and subsequently filmed at 8‐min intervals. The presence or absence of cortical LGN was scored at 32 min after NEB. n = 3 experiments, *P = 0.0014, multiple t‐test. Graph shows mean ± SEM.
HeLa cells stably expressing GFP‐LGN and transiently expressing RFP‐H2B were mock‐ or siRNA‐transfected for 24 h. Cells were treated with 12.5 μg/ml noscapine to induce chromosome misalignments. After 30 min, Hoechst 33342 was added to the medium to visualize the chromosomes. Another 30 min later, live images of mitotic cells with misaligned chromosomes were taken within 1 h. Images were later used to measure the distance of misaligned chromosomes to the closest cortical region and to score for cortical LGN presence or absence in the same region.
Representative images of mock‐ and Ran‐depleted cells from the experiment described in (D). The histograms show the effect of misaligned chromosome position on cortical LGN enrichment. The frequency of incidents was plotted where cortical LGN was excluded (black bars) or enriched (red bars) from the nearest misaligned chromosome.
Data information: (A–D and F) Scale bars represent 10 μm.

