
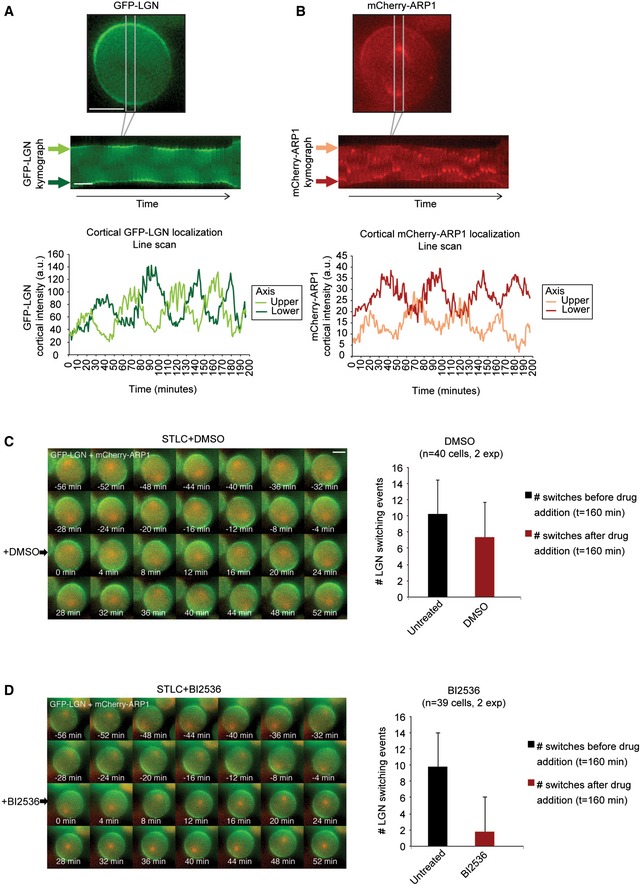
Figure EV5. Spindle pole‐localized Plk1 restricts cortical LGN localization.
-
A, BKymographs showing the cortical enrichment sites of GFP‐LGN and mCherry‐Arp1 switching in a single HeLa cell. Images were taken every 5 min. As an example, a cell was selected that took almost 200 min to complete mitosis to be able to show multiple switching events. Line scans were made from the kymographs of both the “upper” and the “lower” cortical regions. Fluorescence intensity values are corrected for background fluorescence.
-
C, DGFP‐LGN‐ and mCherry‐Arp1‐expressing HeLa cells were treated with STLC to induce monopolar spindles and filmed for 160 min. Subsequently, DMSO or BI2536 was added (at t = 0 min) and filmed for an additional 160 min. The number of switching events observed for cortical GFP‐LGN before and after the addition of the secondary drug is plotted on the right. Graphs show mean + SD.