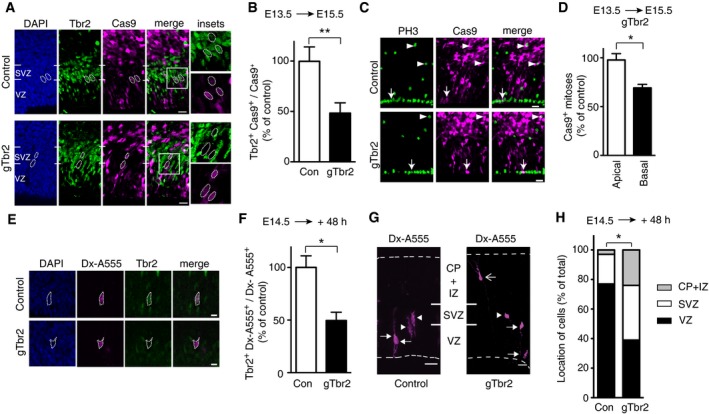
A–DNeocortex of mouse E13.5 embryos was in utero electroporated with a plasmid encoding, under constitutive promoters, Cas9_T2A_PaprikaRFP and gRNA targeting either LacZ (Control, Con) or Tbr2 (gTbr2), followed by analysis at E15.5. (A) Electroporated area showing the effects of Cas9 expression (revealed by PaprikaRFP fluorescence, magenta) together with either control gRNA (top) or gTbr2 (bottom) on Tbr2 expression (green); blue, DAPI staining. Boxes indicate areas shown at higher magnification in the insets (45 × 45 μm). Dotted lines indicate nuclei of progeny of electroporated aRGCs; note the presence of Tbr2 immunoreactivity in the control (top) and its absence upon Cas9/gTbr2 plasmid electroporation (bottom). (B) Quantification of the proportion of Cas9+ cells that are Tbr2+ 48 h after control (Con, white) or gTbr2 (black) plasmid electroporation. Data are the mean of four independent experiments (six embryos per condition, from four litters). (C) Electroporated area showing the effects of Cas9 expression (revealed by PaprikaRFP fluorescence, magenta) together with either control gRNA (top) or gTbr2 (bottom) on the abundance of mitotic progenitors as revealed by phosphohistone H3 (PH3) immunofluorescence (green). Apical and basal mitoses are indicated by arrows and arrowheads, respectively; note the reduction in mitotic Cas9+
BPs upon Cas9/gTbr2 plasmid electroporation. (D) Quantification of apical and basal Cas9+ mitoses (as revealed by PH3 immunofluorescence) in a unit area 48 h after Cas9/gTbr2 plasmid electroporation. Data are expressed as percentage of the data obtained upon control plasmid electroporation and are the mean of three independent experiments (three embryos per condition in total, from three litters); note the reduction in basal (black, 68%) but not apical (white) mitoses.
E–HSingle aRGCs in neocortex in organotypic slices of telencephalon of E14.5 mouse embryos were microinjected with recombinant Cas9 protein together with gRNA targeting either LacZ (Control, Con) or Tbr2 (gTbr2) and with dextran 10,000‐Alexa 555 (Dx‐A555), followed by analysis after 48 h of culture. (E) Progeny of single microinjected aRGCs (revealed by Dx‐A555 immunofluorescence, magenta, dotted lines) showing the effects of Cas9 together with either control gRNA (top) or gTbr2 (bottom) on Tbr2 expression (green); blue, DAPI staining. Note the presence of Tbr2 immunoreactivity in the control (top) and its absence upon Cas9/gTbr2 (bottom) protein microinjection. Images are single optical sections. Scale bars, 5 μm. (F) Quantification of the proportion of the progeny (Dx‐A555+) of microinjected aRGCs that show Tbr2 expression 48 h after control (Con, white) or gTbr2 (black) microinjection. Data are the mean of 3 independent experiments (3 embryos per condition; total number of cells scored: control 45, gTbr2 41). (G) Distribution across the cortical wall of the progeny (revealed by Dx‐A555 immunofluorescence, magenta; arrows, aRGC; arrowheads, BPs; open arrow, neuron) of single control (left) or gTbr2 (right)‐microinjected aRGCs. Dashed lines indicate ventricular surface (bottom) and basal lamina (top). Images are maximum intensity projections of 67 (Control) and 94 (gTbr2) single optical sections. (H) Quantification of the distribution of the progeny (Dx‐A555+) of microinjected aRGCs in the VZ, SVZ and intermediate zone/cortical plate (CP+IZ) 48 h after control (Con, white) or gTbr2 (black) microinjection (total number of cells scored: control 37, gTbr2 51, pooled from at least 3 independent experiments). Note that upon gTbr2 microinjection, the distribution of cells across the various cortical zones is significantly different (VZ: control 77%, gTbr2 39%; SVZ: control 20%, gTbr2 37%; IZ/CP: control 3%, gTbr2 24%; *P < 0.05, Kolmogorov–Smirnov test).