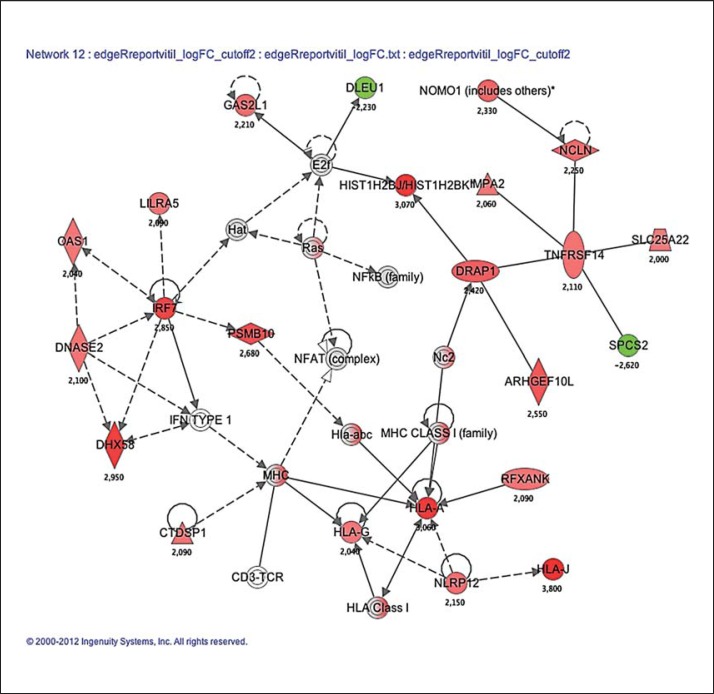
Fig. 2.
The illustration of genes in a pathway associated with dermatological diseases and conditions, immunological disease and inflammatory disease (table 4) (filter set to p < 0.05 after false discovery rate correction) in vitiligo patients compared to controls. Gene expression profiles were uploaded to the Ingenuity Pathway Analysis software and based on the differential expression of these genes, the most relevant biochemical network with functional links is found. Green: decreased expression level in patients vs. controls; red: increased expression level; gray: similar expression level; white: no associations between vitiligo and the gene were found. The numbers reflect the t value of the statistical comparison with the Bayes moderated t test. The figure was generated through the use of the Ingenuity Pathway Analysis (IPA, Ingenuity Systems, http://www.ingenuity.com).

