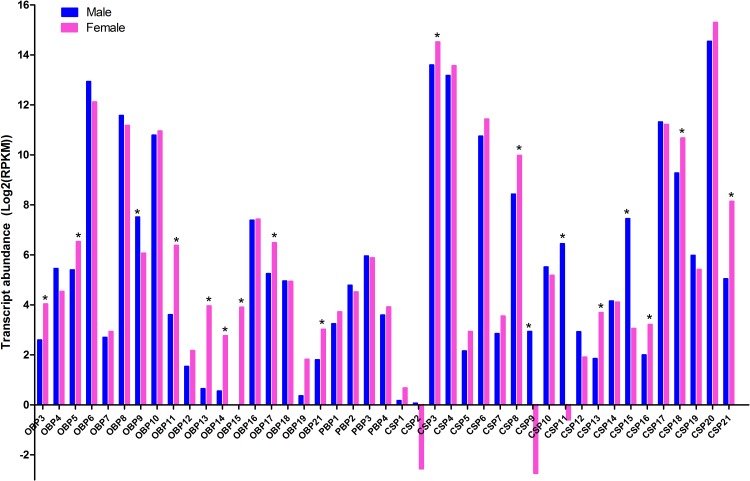
Fig 9. Transcript abundant analysis of chemosensory genes.
In single-end RNA-Seq, the transcript expression abundance was calculated with FPKM value. Differentially expressed genes were identified with the threshold of false discovery rates (PDR)<0.05 and |log2Ratio≥1|. The significant difference between female and male legs samples was indicated by symbol “*”.

