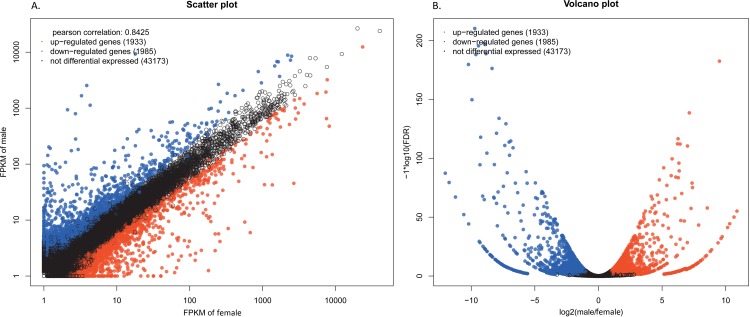
Fig 10.
Analysis of differentially expressed genes exhibited in (A) Scatter plot and (B) Volcano plot. Genes are divided into three distinct subsets: blue genes represent the up-regulated ones in the female legs transcriptome vs. the male legs transcriptome, red genes are the down-regulated class compared in the same way, and black part represents the non-differentially expressed transcripts. Differentially expressed genes are identified according to statistically significant differences with the threshold of false discovery rates (PDR)<0.05 and |log2Ratio≥1|.

