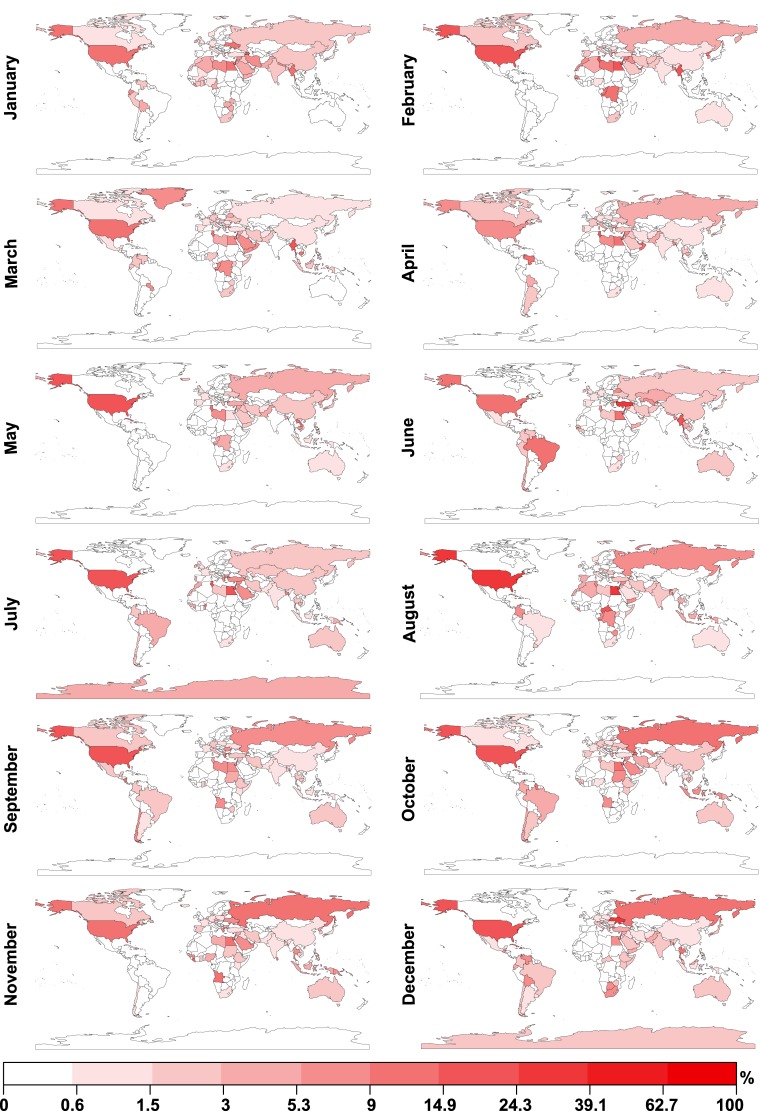
Fig 1. Reports of protests in 2013 in the online edition of The Guardian.
We use data on reports of protests in the online edition of The Guardian as an approximation of the ground truth of when and where notable protest outbreaks occurred. For each of the 244 countries and regions for each month in 2013, we calculate the number of The Guardian articles tagged with the country and region’s name. Here, we depict the percentage of articles for each country and region and each month which were also tagged with the word “protest”. Patterns which can be visually identified in the data reflect known major protest events in 2013: for example, protest outbreaks in both Brazil and Turkey can be observed in June 2013. Equal breaks are calculated for the logarithmically transformed percentages.

