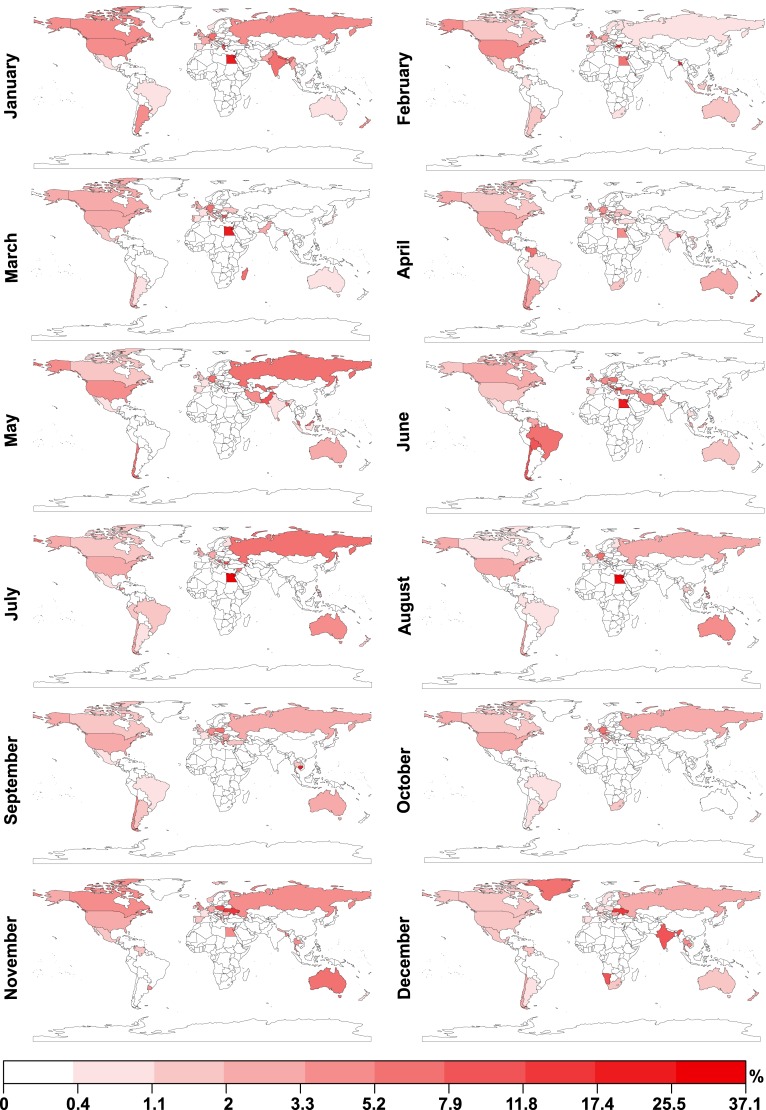
Fig 2. Locations of Flickr photographs labelled with “protest” in 2013.
We investigate to what extent data on the number of photographs tagged with the word “protest” and uploaded to Flickr reflect the ground truth data extracted from The Guardian. For each of the 244 countries and regions for each month in 2013, we calculate the total number of geotagged photographs taken and uploaded to Flickr. Here, we visualise the percentage of photographs for each country and region and each month which were also labelled with the character sequence “protest”. Visual inspection suggests that while there are clear differences between the spatio-temporal distributions of “protest” labelled Flickr photographs and “protest” labelled articles in The Guardian, some key similarities can also be identified, such as an increase in “protest” labelled Flickr photographs in Brazil and Turkey in June 2013. Equal breaks are calculated for the logarithmically transformed percentages.

