Figure 1.
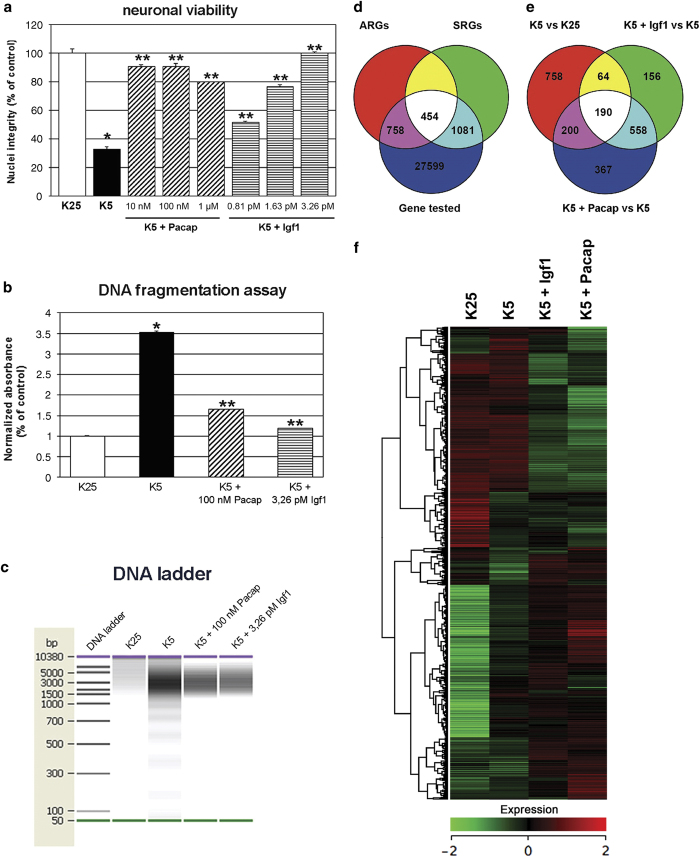
Induction of apoptosis in CGNs and rescue by Igf1 and Pacap treatment. (a) Cultured CGNs at 6 days ‘in vitro’ were switched into serum-free medium containing lower concentrations of extracellular K+ (5 instead of 25 mm) for an acute induction of apoptotic death. Forty-eight hours later, neuronal viability was assessed by counting the number of intact nuclei. Values for neuronal viability represents the mean±S.E.M. of four to eight determinations in two different experiments. Determination of oligonucleosomes generated by cleavage of nuclear DNA was performed with ELISA (b) and electrophoresis on a microchip device (c). Values for DNA fragmentation assay represent the mean±S.E.M. of four to eight determinations in two different experiments. P<0.001 versus K25 (*) or K5 (**) were determined by one-way ANOVA followed by Tukey post hoc test (a and b). (d and e) Genes differentially expressed in apoptotic CGNs (K5 versus K25) were defined as ‘Apoptotic related genes’. Genes differentially expressed in rescued CGNs (K5+Igf1 versus K5; K5+Pacap versus K5) were defined as ‘Survival related genes’. (f) Hierarchical cluster of genes related to apoptosis and rescue of CGNs. ARGs and SRGs were arranged in a dendrogram in which the pattern and length of the branches reflect the relatedness of the expression levels under four different experimental conditions. Green, black and red cells, respectively, are transcript levels below, equal or above the median abundance across all conditions. Color intensity reflects the magnitude of the deviation from the median. The Pearson correlation coefficient of SRG fold ratios (K5+Igf1/K5, K5+Pacap/K5) is 0.97.

