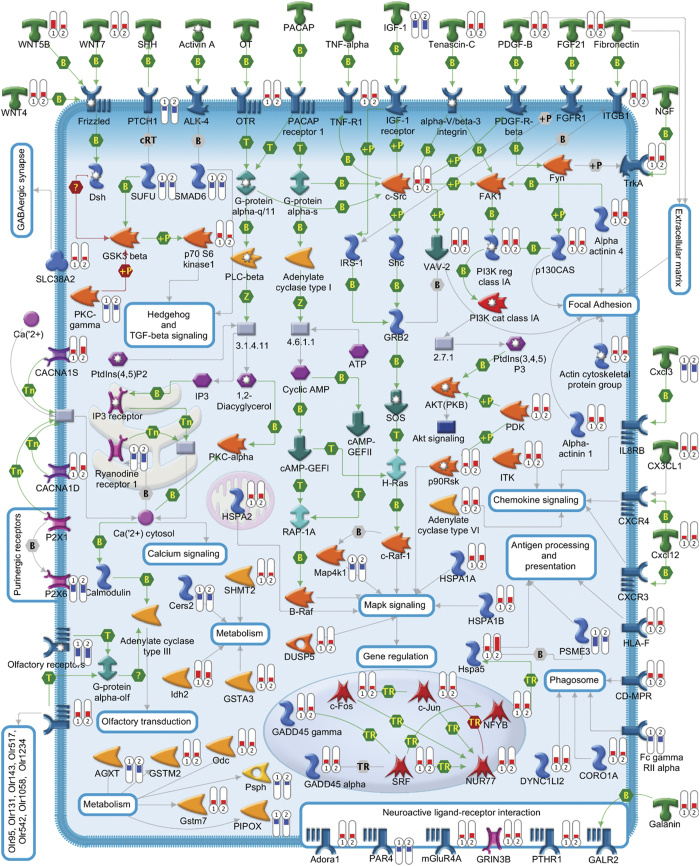
Figure 2.
A comprehensive picture showing gene expression changes and crosstalk of pathways associated with Igf1 and Pacap rescue of apoptotic CGNs. This figure, designed using the MetaCore software (Thomson Reuters, New York, NY, USA), illustrates the gene expression profiles and the 14 signaling pathways that are involved in Igf1 and Pacap neuroprotection of apoptotic CGNs. Each encoded protein is labeled with two thermometers that indicate gene expression changes under the following experimental conditions: K5+Igf1 (first thermometer) and K5+Pacap (second thermometer). More specifically, downward thermometers have a blue color and reflect downregulated expression, whereas upward thermometers have a red color and reflect upregulated expression. Further explanation of symbols used in the pathway map are listed in Supplementary Figure S2.

