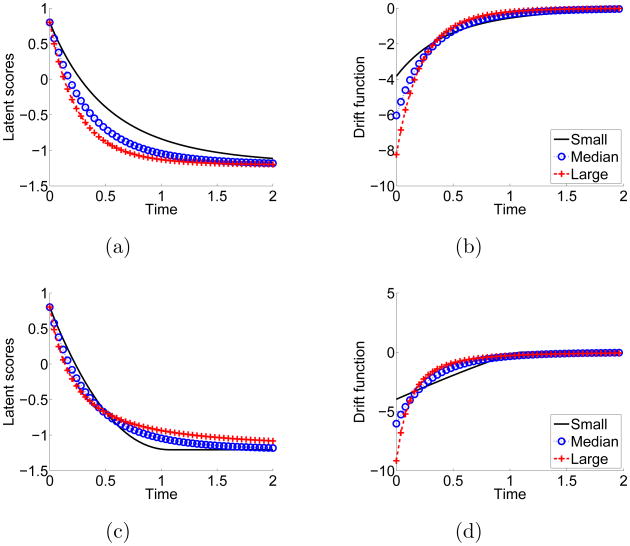
Fig 2.
The latent scores and corresponding drift functions given different parameter values in (2.1). The first row of plots features the expected trajectories and the drift function with different relative change rates, while the second row is those with different change instabilities. The red cross, blue circle, and black solid curves are generated from large, medium, and small relative change rates or change instabilities, respectively.

