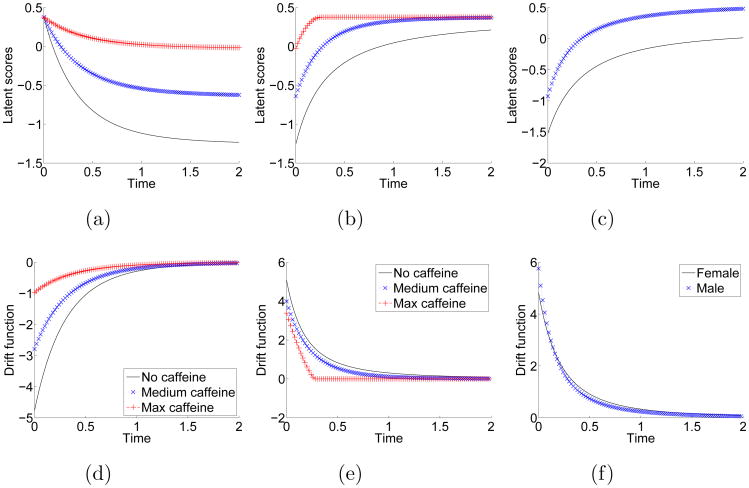
Fig 3.
The first and second columns are the estimated mean trajectories and drift functions of CV trajectories, respectively. The first and second columns show the night dipping and morning surge given different levels of caffeine consumption, respectively. The third column displays the gender differences during morning surge.

