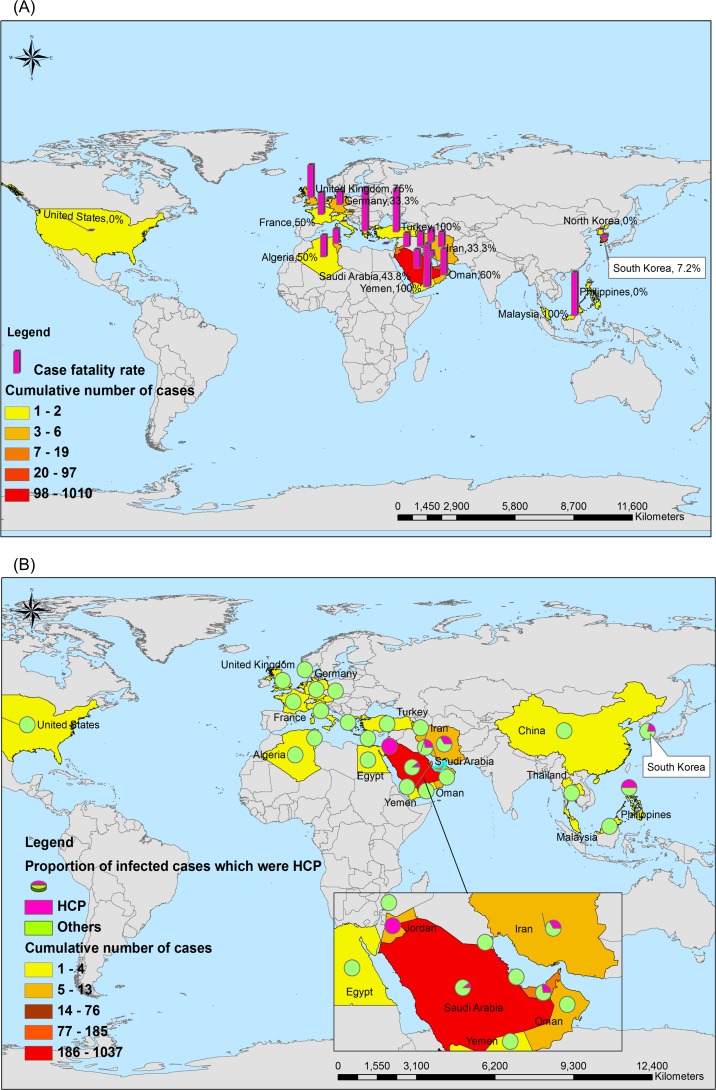
Fig 1. Geographical distribution of 1368 laboratory-confirmed cases, 487 deaths and 183 healthcare personnel (HCP) infected with MERS-CoV from April 1 of 2012 to July 7 of 2015.
Notes: 1a: Overall MERS cases and the case fatality rate. The denominator is the cumulative number of total cases with MERS-CoV; Numerator is the case fatality rate in total cases. 1b: Overall MERS cases and percent of HCP with MERS infections. The denominator is the cumulative number of total cases with MERS-CoV; Pie represents the percentage of HCP and non HCP among the total cases.

