
Fig 3. Expression of differentially expressed miRNAs in DN patients analyzed by microarray and qRT-PCR.
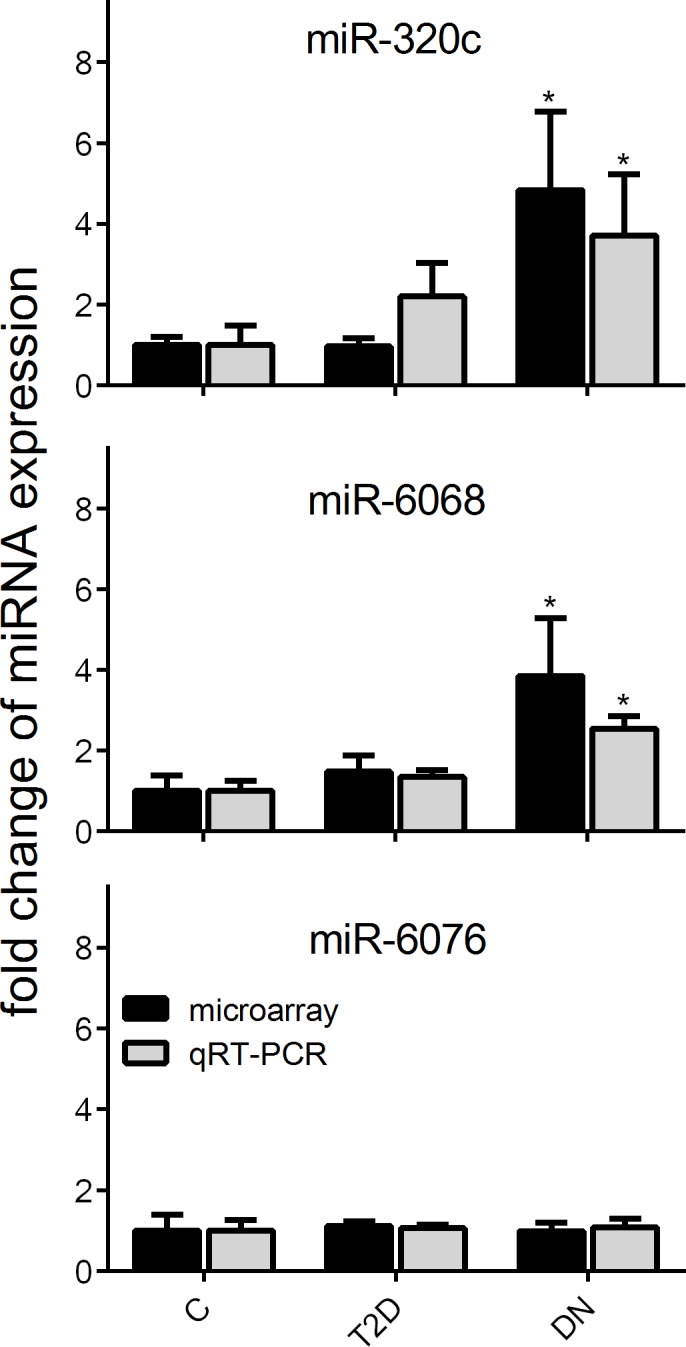
Gene expression profiles of up-regulated miR-320c and miR-6068 and unresponsive miR-6076 were verified by qRT-PCR. Relative miRNA expression was normalized to the mean expression of healthy controls. Significant differences to controls are indicated by * (P<0.05).