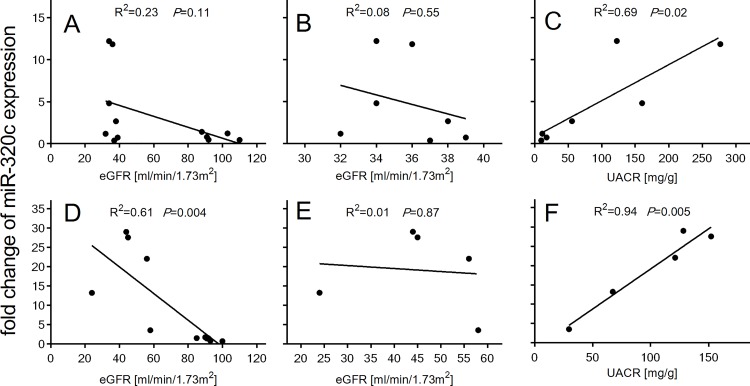
Fig 5. miR-320c expression correlation with eGFR and UACR.
Correlation between miR-320c expression in T2D and DN patients and historical eGFR in the screening cohort (A) and the confirmation cohort (D). Correlation between miR-320c expression only in DN patients and historical eGFR in the screening cohort (B) and the confirmation cohort (E). Correlation between miR-320c expression in DN patients and UACR in the screening cohort (C) and the confirmation cohort (F). Data were compared by Pearson´s correlation coefficient.

