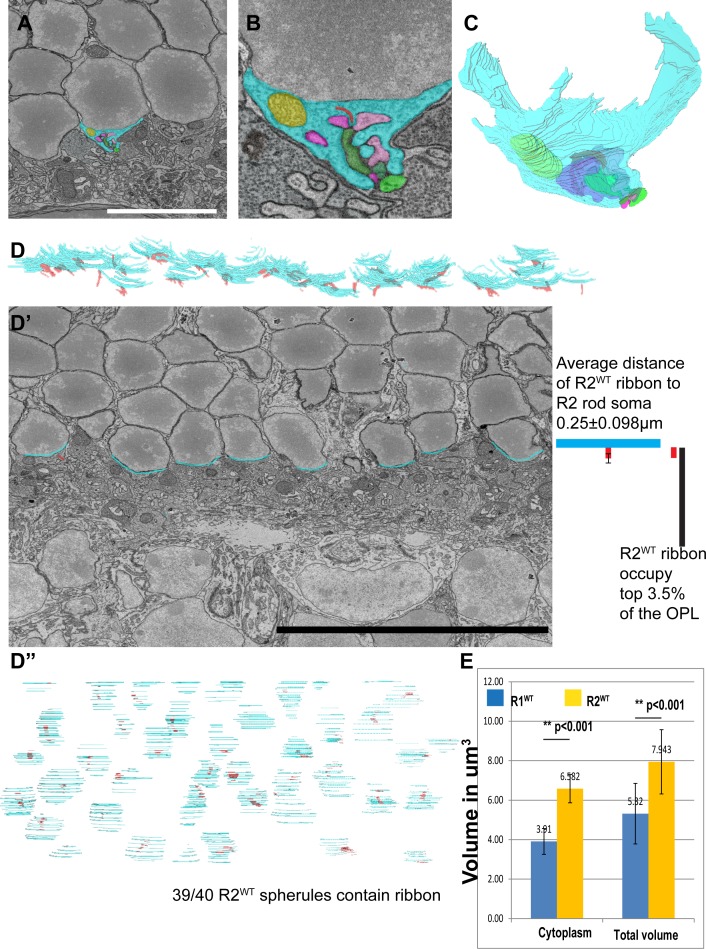
Fig 3. The apical layer of ONL rods primarily have an R2 spherule configuration.
A, WT type 2 rod spherule (R2) is adjacent to the rod soma. B, A high magnification image of the R2 spherule. C, 3D reconstruction of the R2 spherule. D-D”, Overview of R2 spherules for all rods in a volume. D, Side view of 3D reconstruction of the R2 rod surfaces, in which all R2 rods reside at the basal layer of the OPL and do not project axons. D’, Single EM image of the bottom surface of type 2 rods. The distance between the R2 nucleus surface and the middle of ribbons was measured. D”, En face view of R2 spherule reconstruction with attached ribbons. E, Quantification shows type 1 and type 2 rod spherules are significantly different in cytoplasm and total volumetric measurement (n = 10, cytoplasm R1 std dev = 0.6, R2 std dev = 1.5, total volume std dev R1 = 0.7, R2 std dev = 1.6 unit in μm3). Scale bar in A is 7μm in A, 1.7μm in B. Scale bar in D’ is 20μm.

