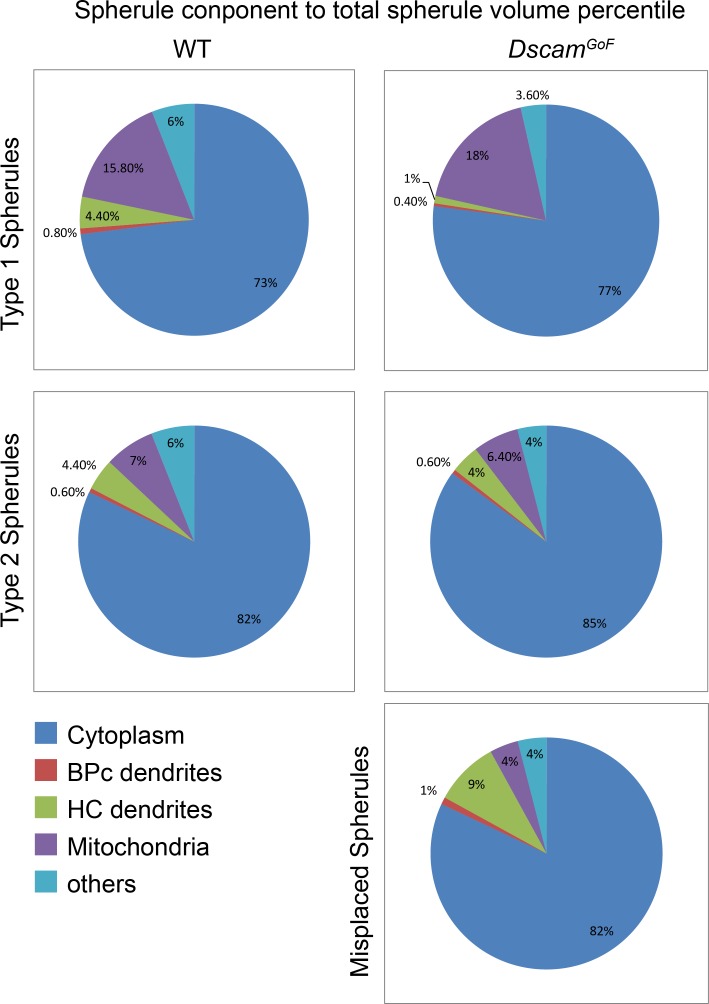
Fig 8. Percentile comparison illustrating spherule aspects.
Pie graphs of the ratio of cellular components to the total spherule volume. We demonstrated that type 1 and type 2 spherules are closer in ratio perspective to each other in different genotypes than type 1 and type 2 spherules in the same genotype. Misplaced spherules are generally closer to type 2 spherules in ratio measurement.

