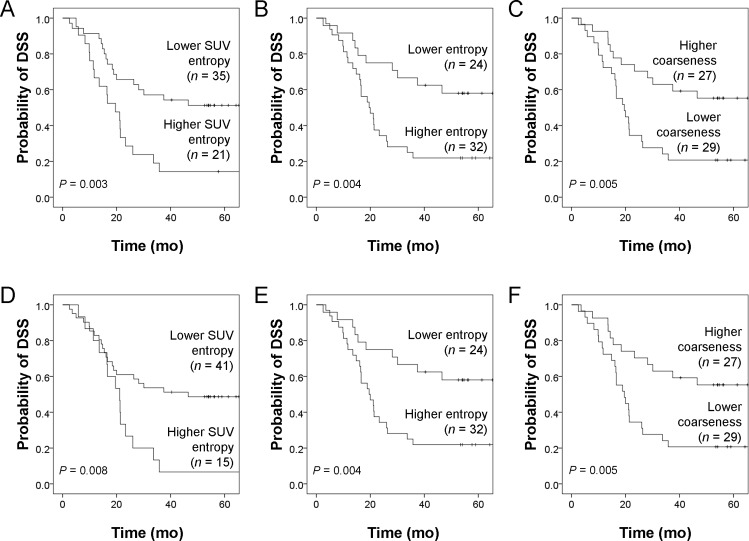
Fig 2. Kaplan-Meier estimates of disease-specific survival (DSS) from PET/HCT (A-C) and PET/ACT (D-F) parameters.
Kaplan-Meier estimates of DSS stratified according to distinct cut-off values of PET/HCT and PET/ACT parameters. Cut-off values are shown in S2 Table. Log-rank test P values are also reported.

