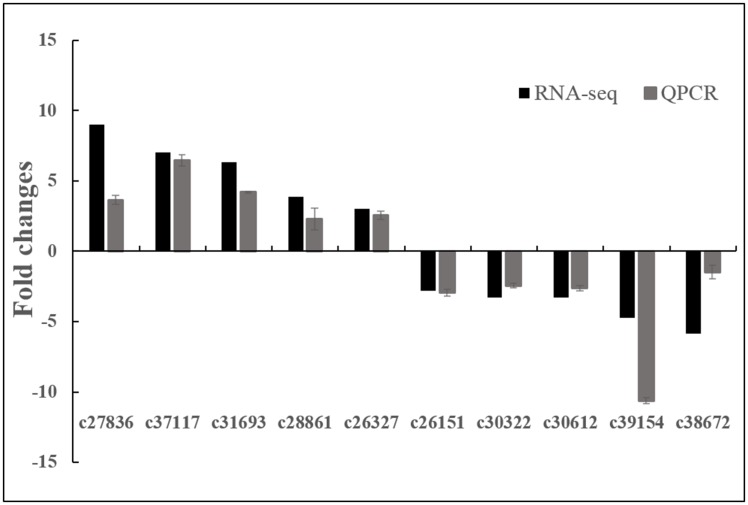
Fig 5. Verification of RNA-seq results by real-time quantitative PCR (QPCR).
The black bars represent fold changes based on FPKM calculated from globally normalized RNA-seq data. The gray bars with standard errors indicate fold changes based on the relative expression level determined by qPCR using the 2-ΔΔCT method for three biological replicates under saline (300 mM NaCl) and normal conditions.

