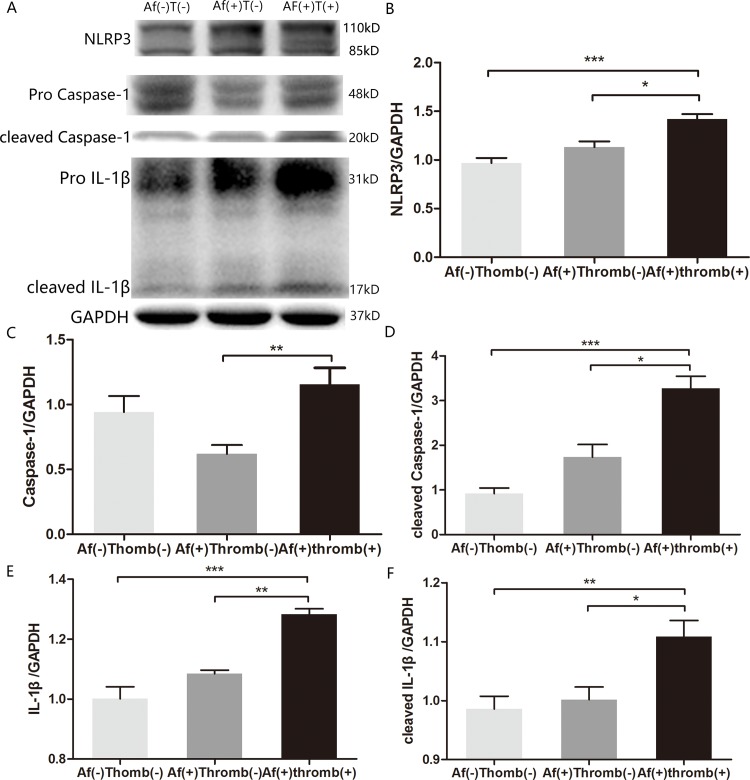
Fig 2. Immunoblot of inflammasome components in lysates of atrium.
(A) Representative plot showing expression of NLRP3, pro- and cleaved caspase-1, pro- and cleaved IL-1β. GAPDH represents the loading control. (B-F) Semiquantitative analysis of inflammasome expression; NLRP3, pro- and cleaved caspase-1, and pro- and cleaved IL-1β expressions were significantly increased in patients with AF and thrombosis. * denotes P < 0.05, ** denotes P < 0.01, *** denotes P < 0.0001.

