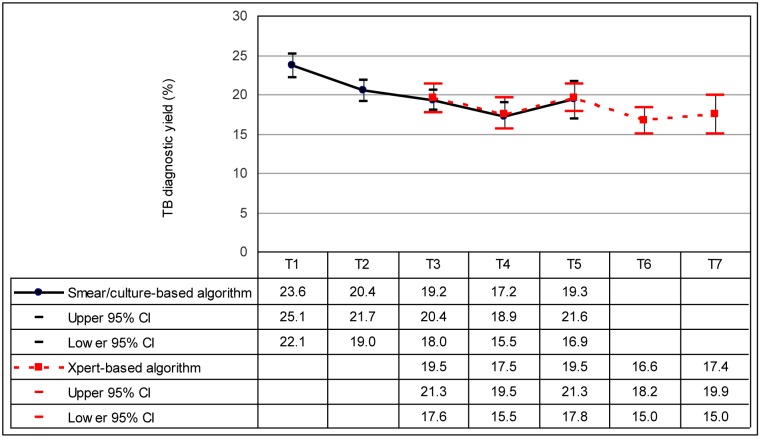
Fig 3. TB yield in the smear/culture and Xpert® based algorithms at PHC sites in Cape Town by time-point.
The graph shows the proportion of presumptive cases identified with TB (and 95% confidence intervals) in the smear/culture and Xpert-based algorithms as PHC sites changed from the former to the latter over seven time points (T1 to T7). Estimates derived from the binomial regression analysis were adjusted for clustering of cases at PHC sites. Time points were as follows: T1 = November 2010, T2 = May 2011. T3 = November 2011, T4 = May 2012, T5 = November 2012, T6 = May 2013, T7 = November 2013. Abbreviations: TB—tuberculosis, PHC—primary health care, CI—confidence interval.

