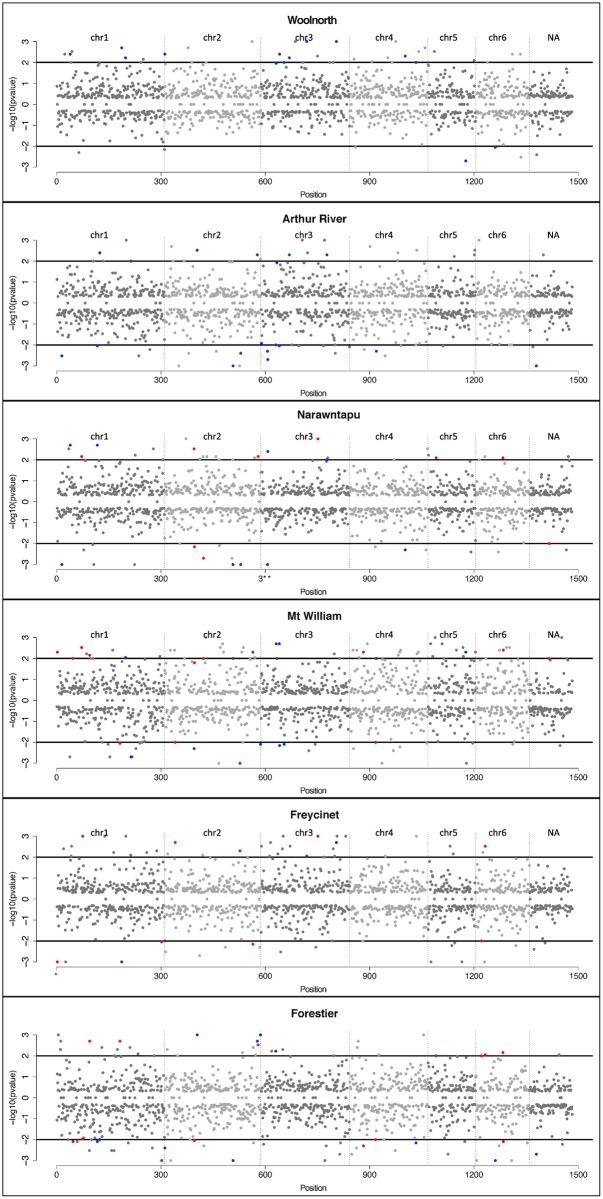
Fig 4. Support for SNPs under selection in Tasmanian devil populations.
Results from WFABC based on an effective population size of Ne = 500. Black vertical lines divide the SNPs into chromosome assignment. For each SNP Bayesian P-value on a log10 scale is given. Black horizontal lines correspond to a threshold of P = 0.01 for positive selection (above) and negative selection (below) null. Loci under selection for multiple populations are indicated with colored dots: non-DFTD vs. DFTD (blue) and DFTD vs. DFTD (red); none of the SNPs were shared only between the control populations.

