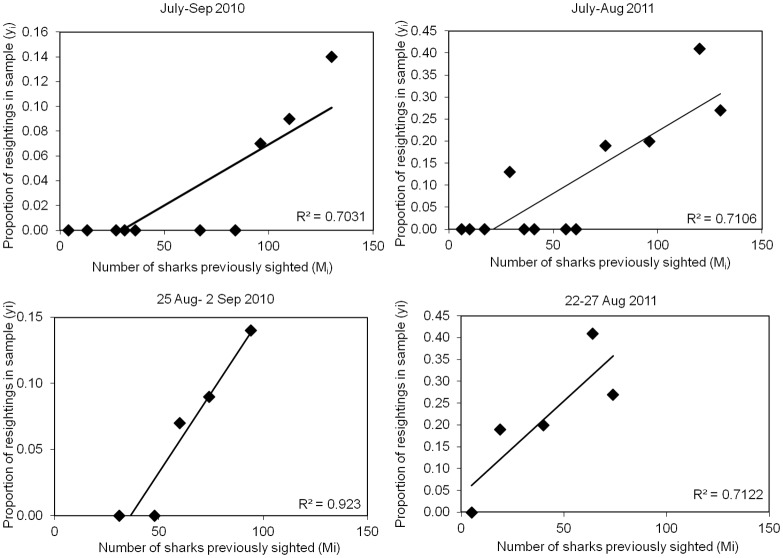
Fig 6. Increase in proportions of sharks re-sighted during the periods used for population estimates.
The figure shows for the Inner Hebrides study area the increase with time in the proportions of recognisable sharks that were re-sighted plotted against the cumulative numbers of individuals previously recorded for: the entire 2010 season (July–September) (upper left), the 2010 peak-sightings period (August 25 –September 2) (lower left), the entire 2011 season (July–August) (upper right), and the 2010 peak-sightings period (August 25 –September 2) (lower right).

