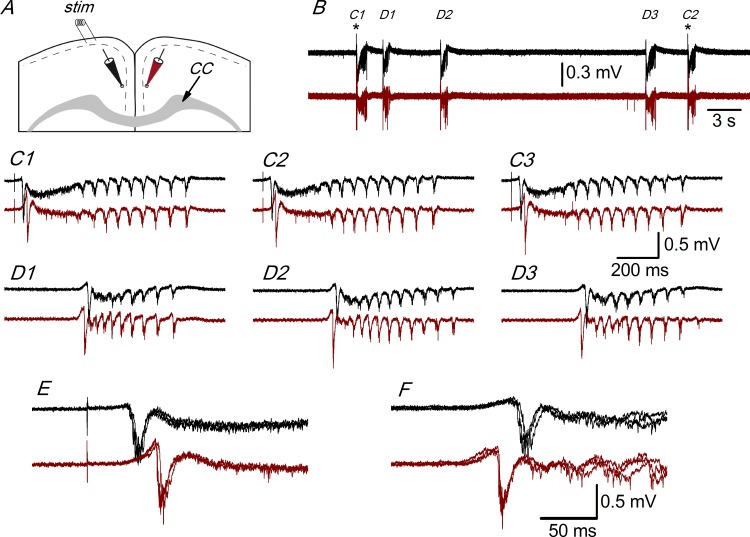
Fig 1. Interhemispheric propagation of synchronous discharges.
A, Drawing of a coronal slice indicating the position of the stimulus electrode ("stim") and two extracellular recording electrodes. CC: corpus callosum. B, Simultaneous extracellular recordings obtained with electrodes placed as shown in panel A; black trace: recording from the ipsilateral hemisphere (with respect to the stimulus electrode); dark red trace: recording from the contralateral hemisphere. In both recordings, there are evoked responses (C1 and C2) and spontaneous responses (D1-D3); asterisks mark the stimulation time. C1-C3, Evoked responses from the recordings of panel B shown at enlarged scale; C3 is the following evoked response not shown in panel B. D1-D3, Spontaneous responses from panel B shown at enlarged scale. The initial negative spikes of the evoked (C1-C3) and spontaneous (D1-D3) responses are shown enlarged and superimposed in panels E and F, respectively. Recordings from a P17 animal.

