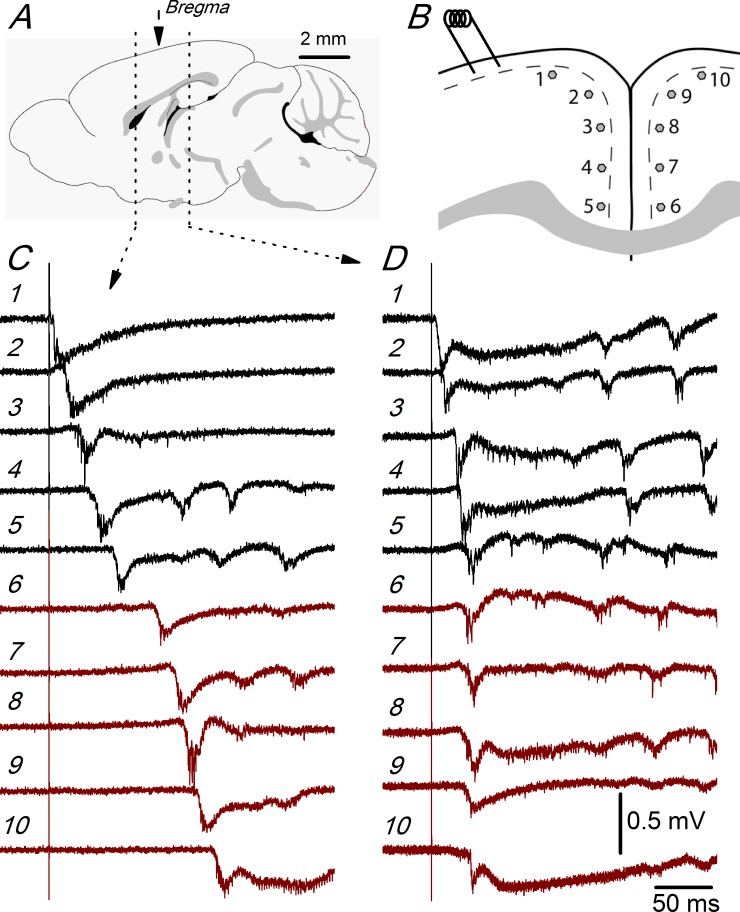
Fig 2. Propagation of synchronous discharges in the ACC and RSC.
A, Sagital drawing of the mouse brain showing the two rostro-caudal levels from which the recordings shown in panels C and D were obtained. The middle arrow shows the position of the bregma reference point. The rostral level to the bregma is at the ACC and the caudal level to the bregma is at the RSC. Fig taken from the mouse brain atlas of the Allen Institute (www.brain-map.org). B, Position of the stimulus electrode and the 10 recording sites used in these experiments; in ACC slices, the average distance between recording sites was 440 μm; in RSC slices, the relative position of the recording sites (in both hemispheres) was the same, but the average distance between recording sites was 370 μm. C and D, Recordings obtained at each of the recording sites shown in panel B obtained from an ACC slice (C; 0.98 mm from the bregma) and a RSC slice (D; -1.06 mm from bregma); the numbers next to the recordings correspond to the recording site numbers in B. Recordings shown in panels C and D are from two slices of the same P19 mouse.

