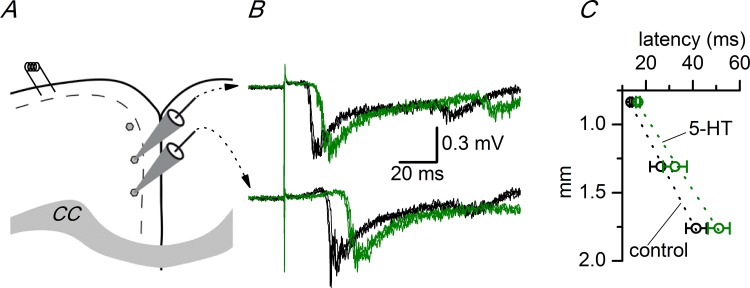
Fig 6. Effect of 5-HT on the propagation velocity of evoked discharges.
A, Drawing of a coronal slice of the ACC showing the stimulus electrode and the three recording positions used to calculate the propagation velocity along layer 2/3. The recording sites were separated by 0.45 mm. CC: corpus callosum. B, Two simultaneous recordings obtained from the two more ventral recording sites shown in A. Three consecutive responses from the control period (black traces) and in the presence of 5 μM 5-HT (green traces). C, Change in the propagation velocity induced by 5 μM 5-HT in the ipsilateral cortex; the conduction velocity was calculated as the slope of the linear fit (dotted lines) to the latencies measured at the three recording sites shown in panel A. Control: 33.92 mm/s, 5-HT: 27.43 mm/s (n = 2–8). The vertical axis shows the distance measured from the stimulus electrode. The data points used to calculate the averages in panel C are available in S5 Table.

