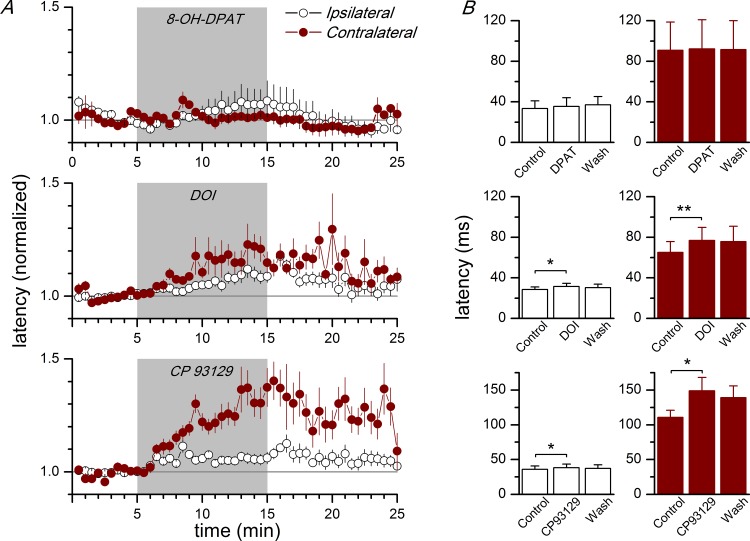
Fig 8. Effect of agonists of 5-HT receptors on the latency of synchronous discharges.
A, Time course of the latency of synchronous discharges evoked by stimulation of layer 1 during the application of 10 μM 8-OH-DPAT (5-HT1A agonist, upper panel; ipsilateral and contralateral n = 4), 10 μM DOI (5-HT2A agonist, middle panel; ipsilateral n = 22, contralateral n = 10), and 10 μM CP93129 (5-HT1B agonist, bottom panel; ipsilateral n = 12, contralateral n = 6). The agonists were applied during the time marked by the gray area; latencies are given as percentage of the control value (white symbols are ipsilateral latencies and dark red symbols are contralateral latencies). B, Effect of the application of 10 μM 8-OH-DPAT (upper histograms; ipsi- and contralateral n = 4), 10 μM DOI (middle histograms; ipsilateral n = 22, contralateral n = 10) and 10 μM CP93129 (lower histograms; ipsilateral n = 12, contralateral n = 6) on the latencies of synchronous discharges evoked by stimulation of layer 1 and recorded at ipsilateral recording sites (white columns) and at contralateral recording sites (dark red columns). In each plot, there are pooled values from several recording sites. Latencies were measured and averaged during the last 5 minutes of control, the last 5 minutes of drug application, and the last 5 minutes of the washout. * p<0.05; **p<0.01 with respect to the control (Student's t test for paired samples). The data points used to calculate the averages in panel B are available in S7 Table.

