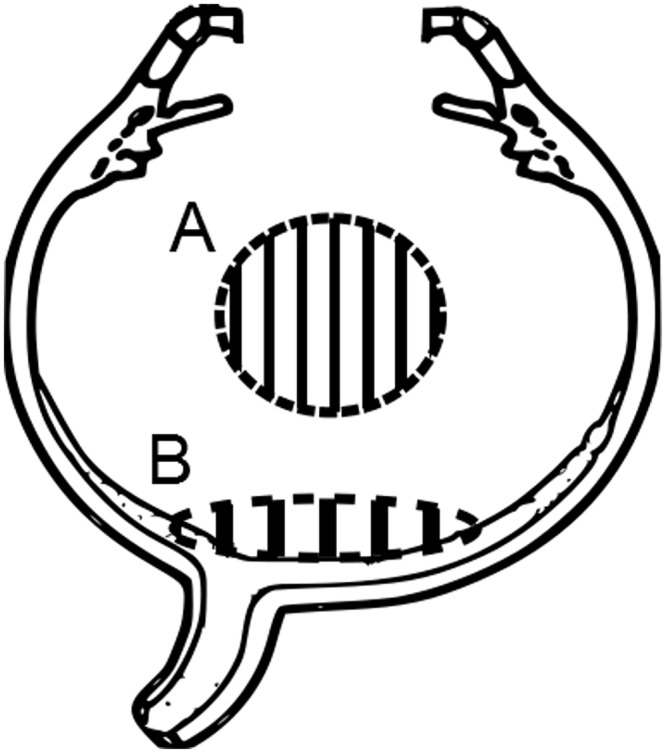
Fig 3. Illustration of vitreous regions that were biopsied for ascorbate measurements.

(A) The site of the mid-vitreous sample collection. (B) The site of the posterior vitreous sample collection.

(A) The site of the mid-vitreous sample collection. (B) The site of the posterior vitreous sample collection.