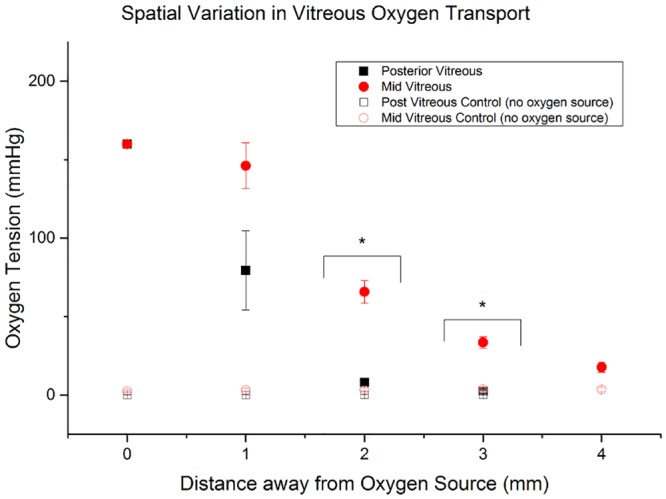
Fig 4. Comparison in oxygen diffusion kinetics between mid and posterior vitreous.

Black Squares: Oxygen tension with increasing distance from an oxygen source in the posterior vitreous. Red Circles: Oxygen tension with increasing distance from an oxygen source in the mid-vitreous. Oxygen tension recordings are higher in the mid-vitreous compared to the posterior vitreous as distance from the oxygen source increases. Black Squares: Oxygen tension recordings with increasing distance from the probe in the absence of any oxygen source in the posterior vitreous. Hollow Circles: Oxygen tension recordings with increasing distance from the probe in the absence of any oxygen source in the mid-vitreous. Hollow Squares: Oxygen tension recordings with increasing distance from the probe in the absence of any oxygen source in the posterior vitreous. Please note that the open symbols are not clearly identifiable because they overlap in the graph.
